
Electricity monitoring
Find the kWh you can't explain.
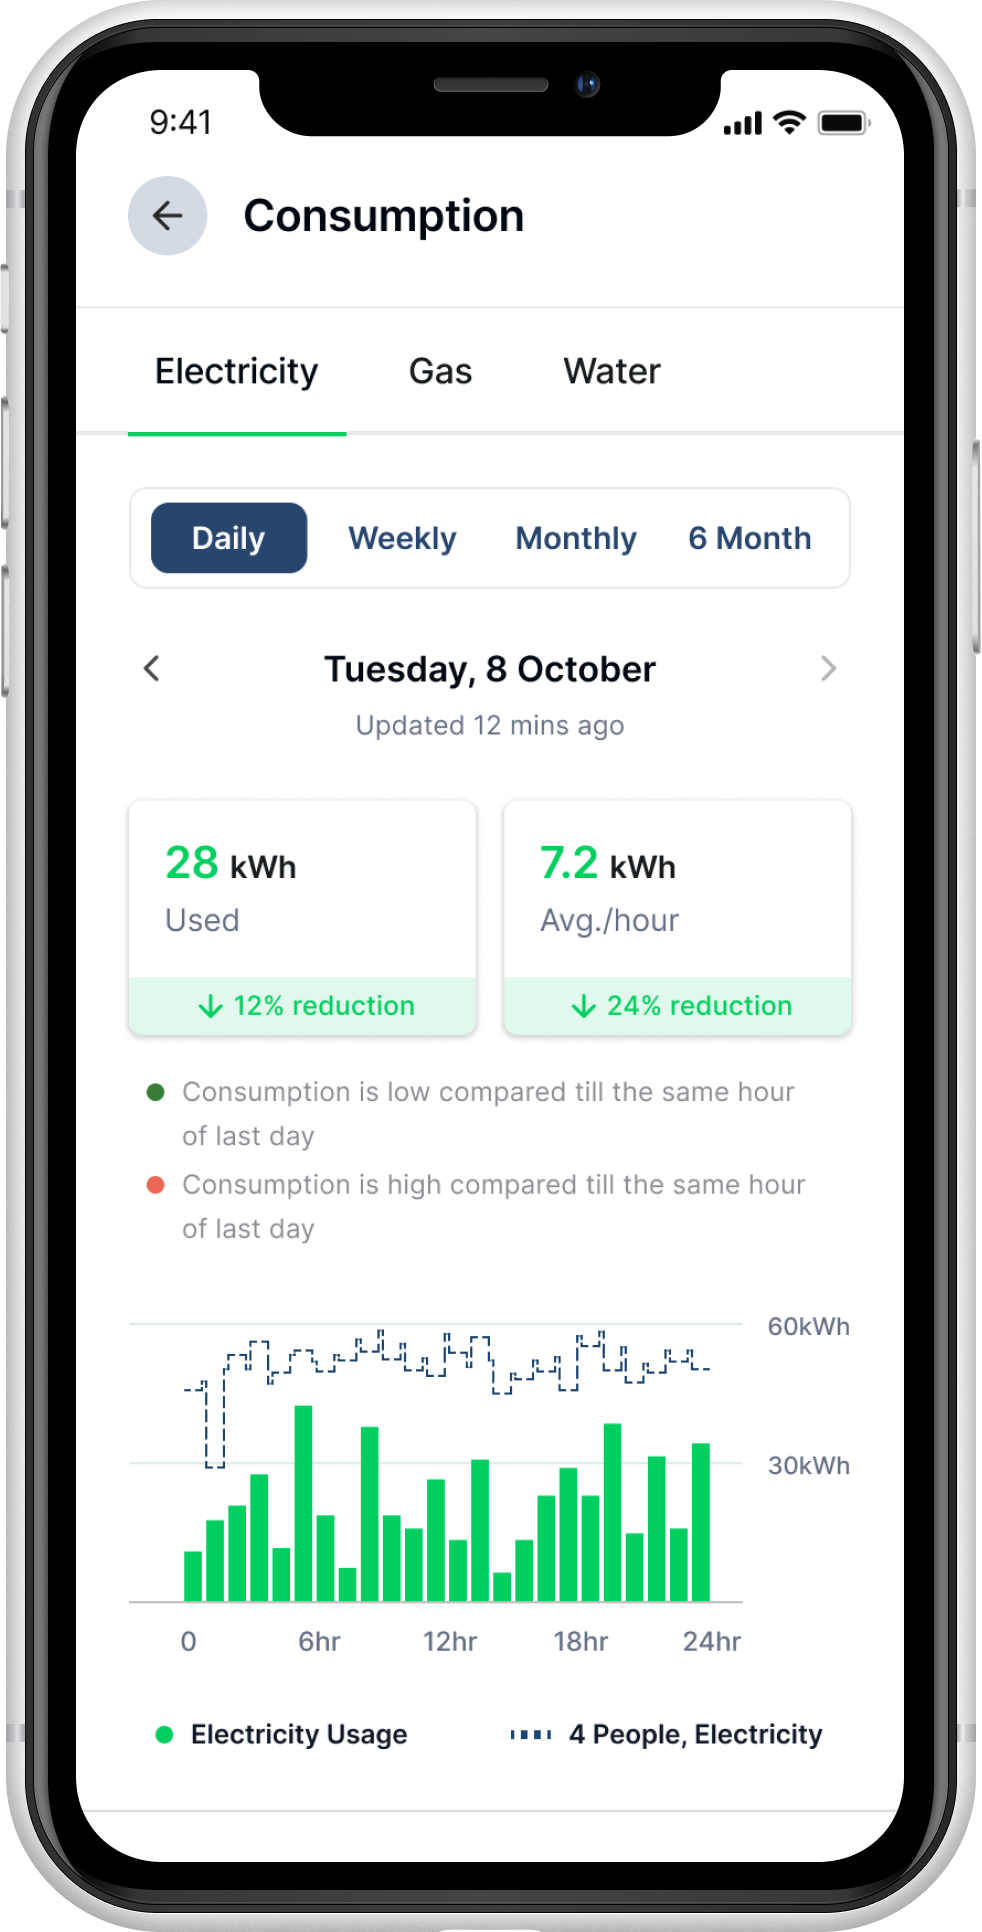
Rhino connects to every electricity meter and submeter in your buildings: main meter, tenant submeters, BMS, HVAC, EV chargers, PV. Consumption refreshed every 15 minutes, in one dashboard. A monthly bill tells you how much. 15-minute data tells you when, where, and why.
15 min
Real-time data granularity
All parameters
Per meter: V, A, cos φ, kW, kWh, kVArh, and more
−30%
Average energy cost savings
40+ countries
Active worldwide
What you see
Every meter. Every floor. Every 15 minutes.
Not just kWh. Rhino captures voltage, current, power factor, and peak demand. Live, with 15-minute history. The data your finance and ESG teams can actually rely on.
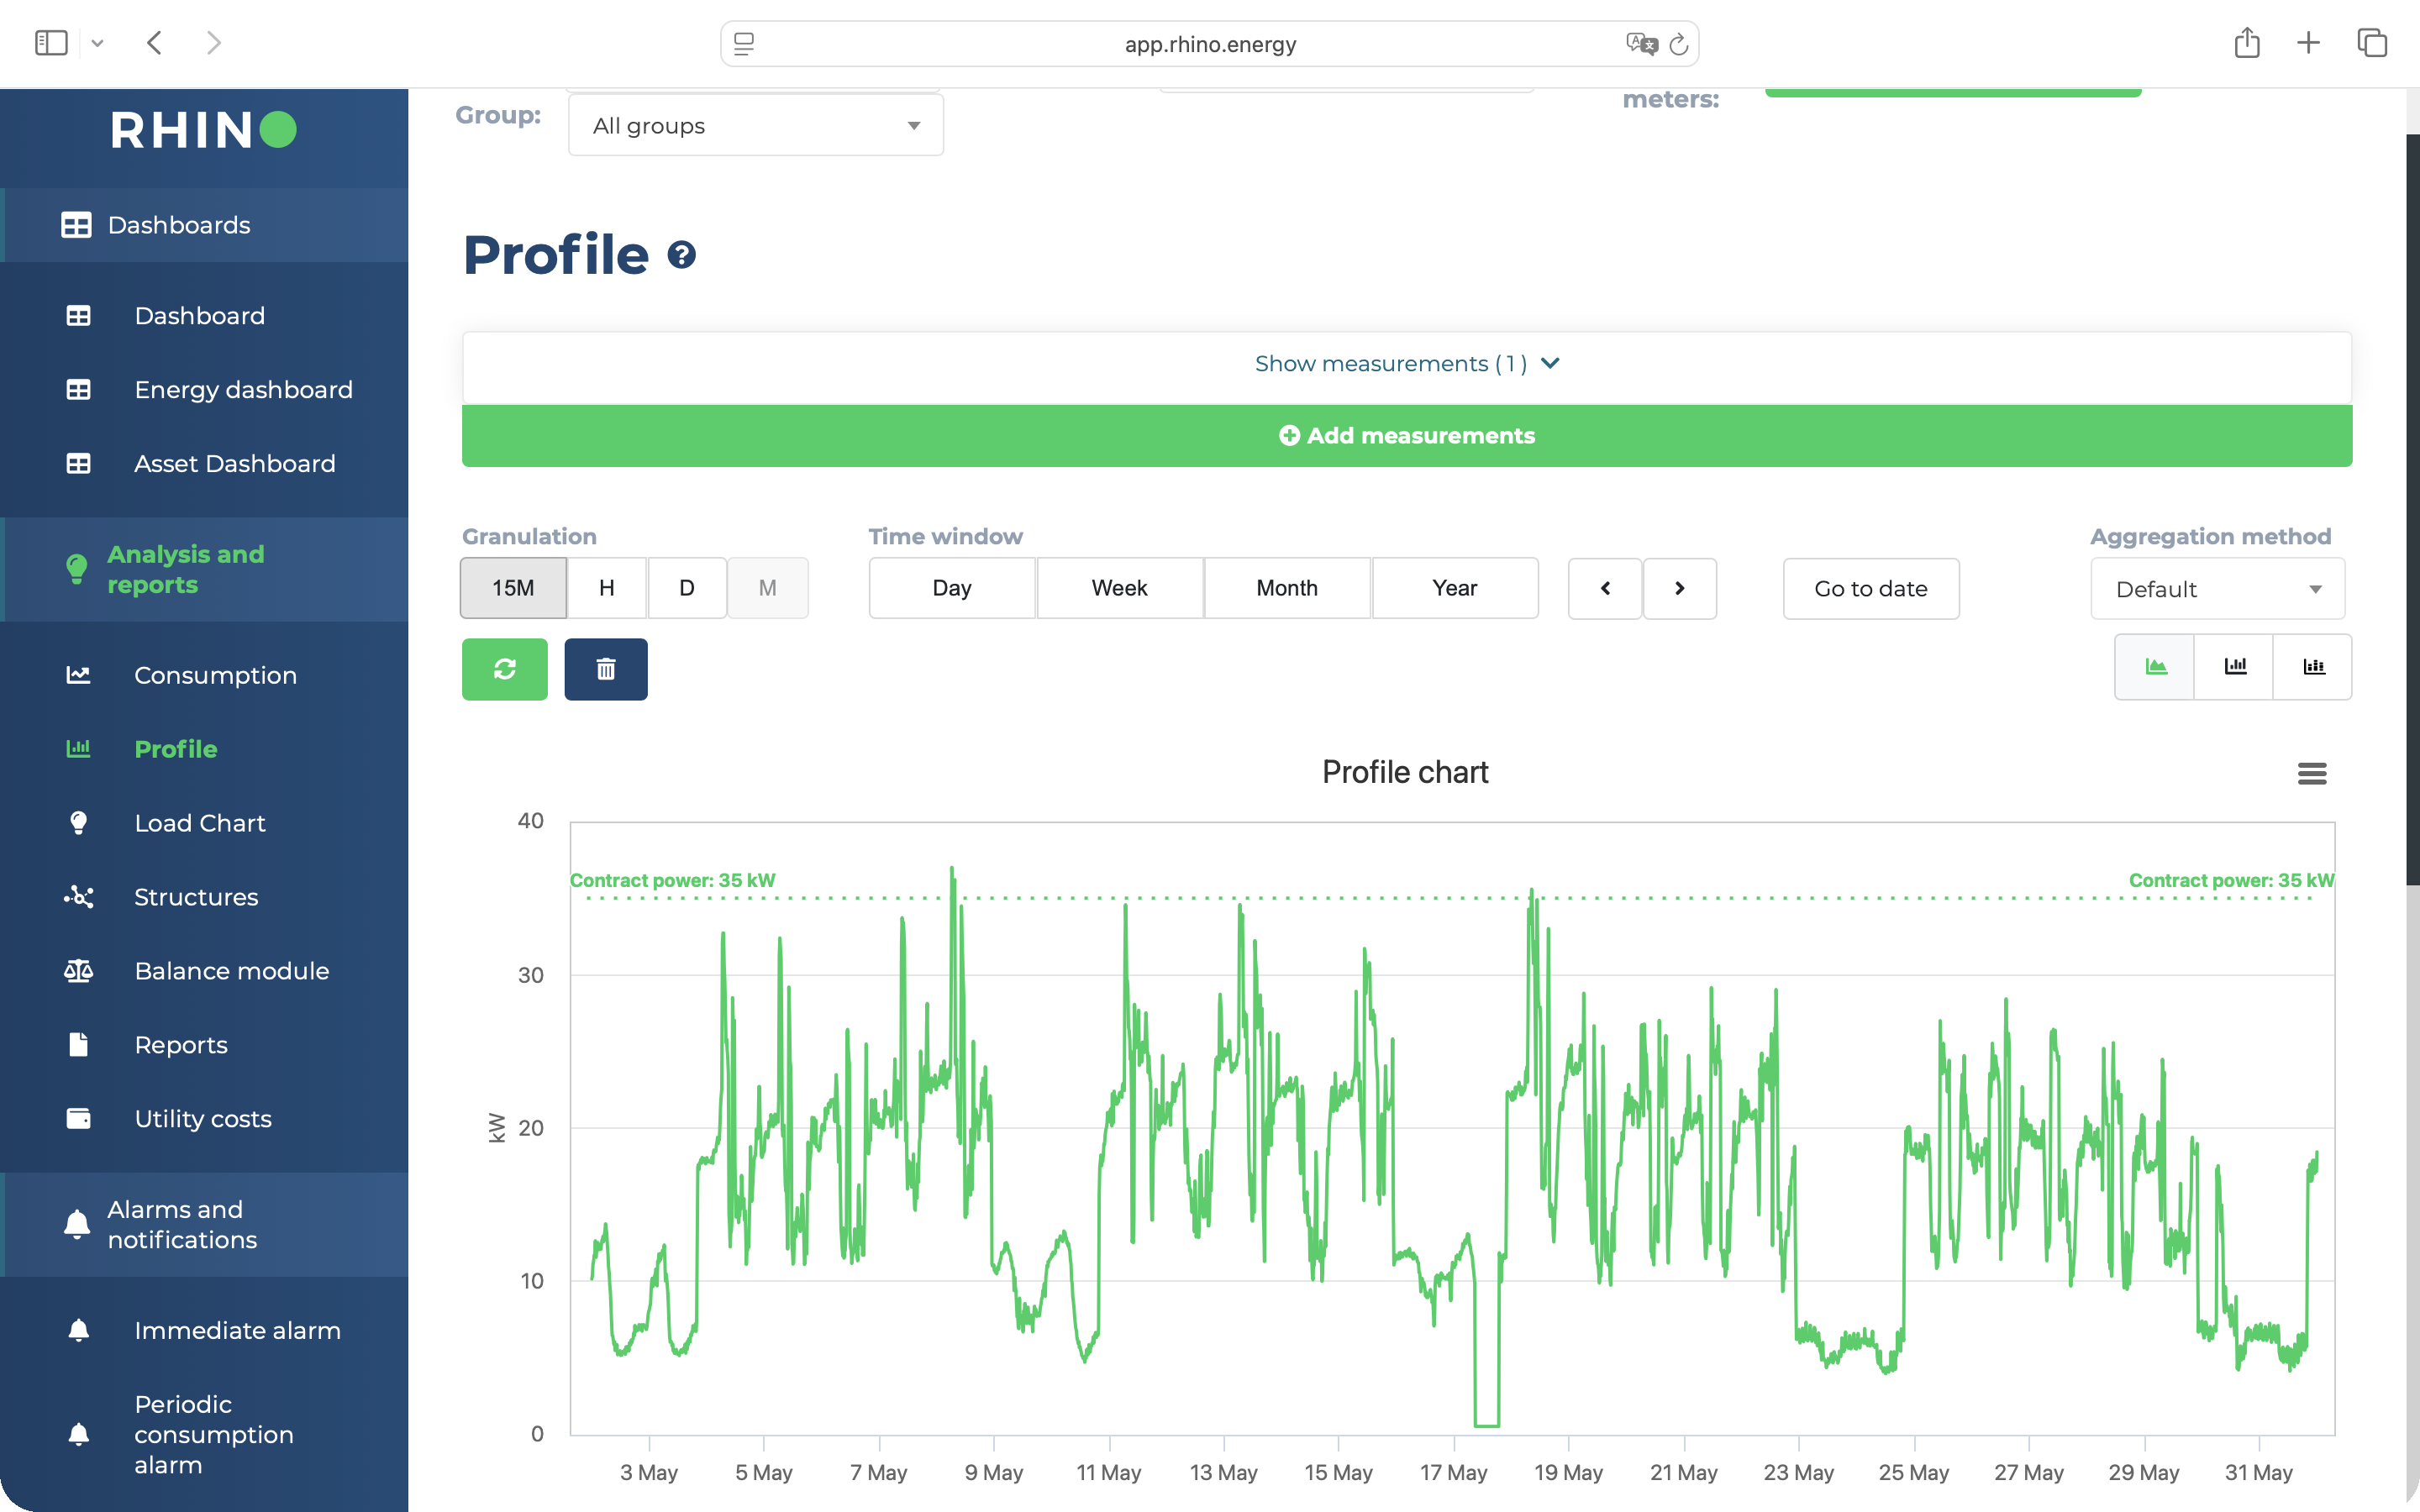
Load profile
Spot what shouldn't be running.
Every meter shows live kW in 15-minute steps against a rolling baseline. After-hours runs, runaway HVAC, equipment left on overnight. They all stand out before the bill arrives.
See how the profile worksSubmeter flow
Where every kilowatt-hour ends up.
Trace electricity from the main meter through every submeter: tenants, HVAC, EV chargers, retail common parts, PV. The Sankey also surfaces what isn't submetered, so you know what's missing.
See structure visualizationPower quality
More than kWh.
Voltage, current, power factor (Cos φ), momentary kW per phase. Max power, contracted power, contract excesses. Live readings for every parameter. The detail you need to balance the load or push back on the operator.
Explore the dashboardAlarms
Email the moment a meter goes wrong.
Set a kW threshold per meter or compare today against yesterday. The platform emails you the meter, location, value, and timestamp the moment a threshold is crossed. No more finding it in next month's invoice.
See how alarms workUtility Connectors
Cloud-to-cloud reads from smart meter networks and utility providers across Europe and North America. No hardware on site.
Rhino Hardware
Small, non-intrusive devices for meters that software can't reach. No rewiring, no downtime, low CAPEX. EU and US certified.
Third Party Infrastructure
Connect via an existing BMS, IoT gateway, or Modbus setup. Adds Rhino to what's already installed. No CAPEX, no replacement required.
What it gives you
Stop guessing. Start knowing.
Three things facility managers do with Rhino electricity data on day one.
Identify waste
Find the load that runs after hours.
Server rooms, HVAC, signage, lighting. Loads that don't show up during a walk-around show up clearly in the 15-minute profile. Most teams find their first round of savings inside the first month.
Read a customer storyTenant allocation
Allocate cost to the meter that used it.
Submeters per tenant or zone make recharging accurate. No more proxy formulas, no more disputes. Export the consumption table straight from the dashboard, ready for invoicing.
See tenant allocationBilling accuracy
Question every invoice with your own data.
Compare the supplier's reading against Rhino's 15-minute data. Catch billing errors and meter faults before they hit the P&L. The audit trail comes built in.
Talk to our team
Proof
Real electricity. Real portfolios.
Logistics
1,660
smart meters connected across 24 GLP warehouses
GLP · 24 warehouses monitored · 160,000+ daily electricity data points delivered to a single dashboard
Read the GLP case study
Residential
39%
reduction in residential electricity by participating residents
Bouwinvest · 449 apartments in Amsterdam · Rhino API connected to the Zig tenant app, so residents tracked and reduced their electricity in real time
Read the case study
Common questions
Electricity monitoring, answered.
Software-first: where a smart meter is already in place, Rhino connects via the utility provider's data feed, P1 port, or meter manufacturer API, no physical work required. For meters without a software-accessible output, we add one of our own readers. Most portfolios run a hybrid setup. No existing metering infrastructure is removed or replaced.
Yes. Where submeters are installed per tenant, zone, or floor, Rhino reads each one individually. You see the consumption breakdown by unit with the same 15-minute granularity as the main meter. The allocation table exports directly from the dashboard, ready for invoicing.
Yes. You set thresholds per meter, for peak demand, overnight baseline, or any value that shouldn't be crossed. When a meter breaches the threshold, an alarm fires immediately. Most clients start with overnight and weekend baselines; those catch the most common issues within the first week of going live.
CSRD Scope 2 requires location-based and market-based electricity consumption per asset, with complete 12-month coverage and no gaps. Rhino gives you consumption in kWh per building and submeter at 15-minute granularity, fully automated. The data exports in formats compatible with most ESG reporting platforms. Full CSRD energy data guide →
From the day you go live, all data is stored and accessible in the platform indefinitely. If a building has a smart meter that was already in place before Rhino connected, we can often pull historical data going back 12 to 24 months through the meter's existing data feed, depending on the utility.
Further reading
From the Rhino blog.


Which electricity meters does Rhino read? Name yours and find out, or check whether your utility provider is connected instead.
Find what's actually on your bill.
Connect your buildings to Rhino and see every electricity meter in 15-minute resolution. Most teams find their first round of savings inside the first month.