


Retail
Multi-site retail
utilities. Allocated.
From shopping centers to chain estates, Rhino delivers per-unit submeter data, defensible service-charge allocation, and the anomaly alarms that catch refrigeration and HVAC drift before they hit shrink.
Why now
The 2025 RICS Service Charge Code raises the bar on transparent utility allocation. Anchor tenants under CSRD increasingly demand consumption actuals as a lease condition. Estimation is becoming legally indefensible.
35-40%
of retail energy cost is HVAC
15-25%
is refrigeration in stores with cold cases
26%
of non-residential stock must be renovated by 2033 under EPBD


The problem
Three things retail operators get wrong.
RICS, EPBD and anchor-tenant CSRD demands all trace back to the same root: service charge billing built on floor-area estimates instead of metered actuals.
Asset Manager · Facility Manager
The 2025 RICS Service Charge Code makes estimation indefensible.
Managers must provide proactive, detailed cost breakdowns with fair allocation by actual usage, not floor area. Shopping centers with mixed anchor and inline tenants are most exposed. Estimation-based billing faces disputes, delayed settlement, and regulatory scrutiny that was not there two years ago.
Facility Manager · Asset Manager
Refrigeration and HVAC drift quietly destroy margin.
HVAC drives 35-40% of retail energy cost, refrigeration another 15-25%. Drift gets caught at the quarterly bill, not in real time, by which point shrink and waste are already booked. The fault that started three weeks ago is still running.
ESG Lead · Asset Manager
EPBD MEPS plus anchor-tenant ESG demands require utility data that most operators cannot produce.
Anchor and corporate tenants need actuals for their Scope 3 reporting under CSRD. Owners, operators, and retail brands often cannot supply them without submeter coverage. The gap shows up in GRESB submissions and lease renewal conversations before it shows up anywhere else.
How Rhino helps
Data that makes your retail portfolio defensible.
Three problems. Three direct responses. All from the same data source.
Service charge allocation built on actuals.
Submeter granularity per unit, per utility, per 15-minute interval. Automated tenant cost allocation feeds straight into Yardi. The disputes that start in spreadsheets stop when the bill sits on measured data.
See Cost ReductionAnomaly alarms catch refrigeration and HVAC drift in hours.
Threshold alarms surface overnight load spikes, drifting defrost cycles, compressor short-cycling. Portfolio dashboards rank stores by intensity for targeted capex. The fault that would have cost a week shows up in hours.
See Portfolio OperationsMulti-site coverage without a full BMS overhaul.
Utility provider API ingestion plus low-CAPEX hardware lets owners, operators, and retail brands structurally meter their estate. ESG-grade exports serve portfolio submissions and tenant Scope 3 demands from the same feed.
See ESG & Compliance
Who uses it
Different roles. Same data.
The asset manager needs RICS-defensible allocation. The FM needs refrigeration alarms. The ESG lead needs GRESB submissions. Rhino delivers all three from one data feed.
Asset Manager
RICS-defensible allocation and portfolio-wide intensity rankings.
RICS-defensible service charge allocation, portfolio-wide intensity rankings, an evidence base for retrofit capex that actually moves the curve. Every building ranked. Every billing dispute resolved on data.
Facility Manager
Refrigeration and HVAC anomaly alarms in real time.
Refrigeration and HVAC anomaly alarms in real time, store-by-store comparison, retrofit verification that proves savings are real. The fault that costs margin shows up in hours, not at the next bill.
ESG Lead
EPBD and GRESB submissions from one dataset.
EPBD and GRESB submissions and tenant Scope 3 data hand-offs from one dataset. No parallel data collection cycle, no estimate-heavy audit trail.
Inside the platform
One platform. All utilities. Every meter.
Electricity, gas, water, heat. Submeter to portfolio. Every meter visible on one dashboard, with alarms, billing exports, and ESG-grade reports built in. The retail portfolio view shows per-store intensity rankings and service charge allocation exports that drop straight into Yardi.
Tour the platform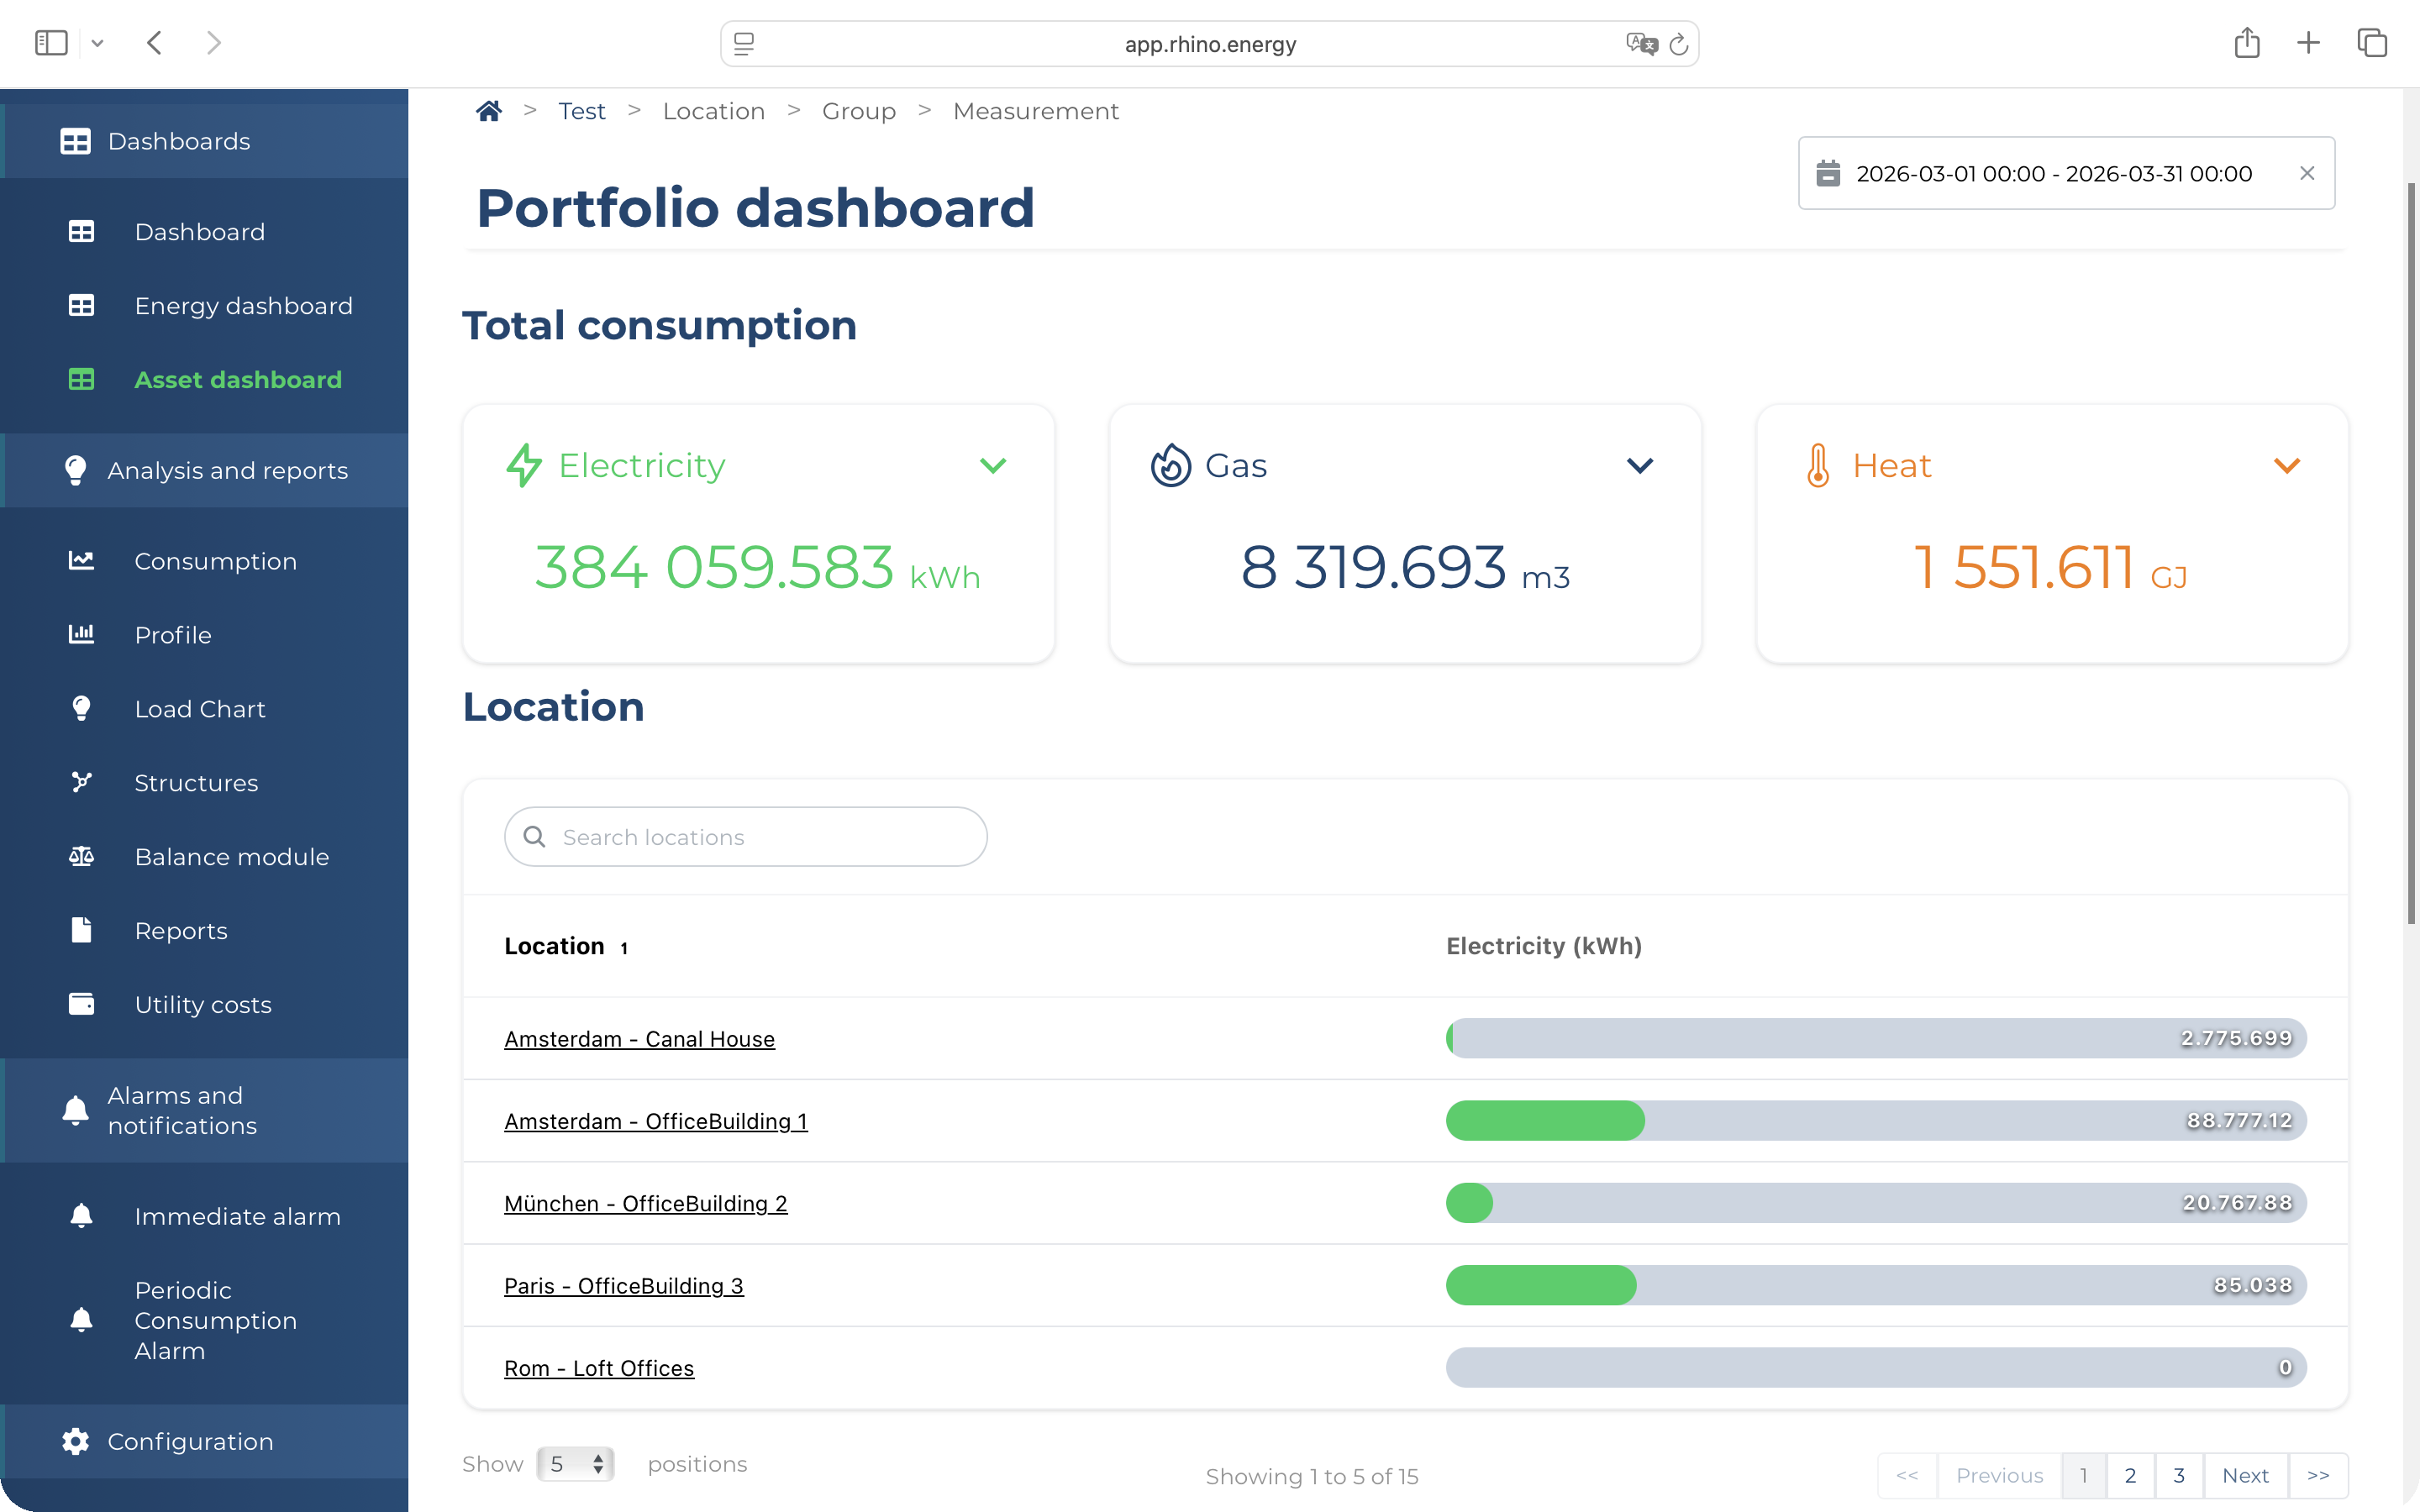
Customer story · Retail
How Westfield monitors all utilities across 4 European stores.
Westfield had no way to accurately split utility costs between tenant spaces and shared infrastructure, and no foundation for its zero-emissions roadmap. They chose Rhino to change both.
Benchmarking across sites. Comparing stores and individual building systems against each other to identify inefficiencies and set reduction targets.
Accurate tenant and common-area allocation. Submeter data replaces estimates. Every utility cost has a verified number behind it.
Live data to central systems via API. ESG reporting and zero-emissions tracking run on real meter data, not estimates.
640
Meters connected
60k
Daily data points
4
Large area stores

Westfield
Energy, Water, Heating, Cooling
Customers
Retail owners, operators, and brands monitoring utilities across Europe.
Shopping centre owners, retail park operators, and retail brands use Rhino to track energy and utility consumption across their assets.
From our retail deployments
What the data actually shows.
Hours
Time to surface a refrigeration fault after connection, not weeks, not at the next bill
€3k+
In hidden gas costs identified at a single retail site within the first month of monitoring
4
Waste streams found at one site: gas running 24/7, heating after hours, weekend spikes, equipment left on
Common questions
Retail utility monitoring, answered.
Yes. Multi-site portfolios are the default. One dashboard rolls up consumption across every store, with per-site, per-utility detail underneath. Adding a new store is a configuration step.
Yes. Threshold alarms flag overnight load spikes, drifting defrost cycles and compressor short-cycling within hours, not at the next bill. The fault that costs margin shows up before it compounds.
Yes. Submeter data per unit feeds automated allocation directly into Yardi. Service charges sit on actuals, not estimates, which is what the 2025 RICS Service Charge Code now expects from property managers.
Rhino tracks per-asset energy use intensity against EPBD MEPS thresholds, so retrofit decisions get targeted to the buildings most at risk of forced renovation. You stop guessing and start acting on measured data.
Yes. Per-tenant exports are audit-ready and drop into the tenant's own Category 8 reporting without manual reconciliation. The data sharing becomes a structured feed, not an annual coordination exercise.
Bring your retail portfolio into focus
Your stores. Your data. Allocated.
See what your portfolio looks like with all utility data in one place. We will walk you through your buildings, your meters, and what reporting looks like the day you go live.
Further reading
From the Rhino blog.

