
Gas monitoring
Find the gas your buildings are wasting.
Rhino connects to every gas meter in your portfolio: main meter, boiler submeters, tenant feeds. Consumption tracked at 15-minute intervals. Anomalies and inefficiencies surfaced continuously, not when the quarterly invoice arrives.
15 min
Real-time data granularity
Scope 1 ready
Verified consumption for CSRD reporting
−30%
Average energy cost savings
40+ countries
Active worldwide
What you see
Every meter. Every boiler. Every anomaly.
Not just total consumption. Rhino captures 15-minute intervals, rolling baselines, and overnight flow figures. The data your operations and ESG teams can actually work with.
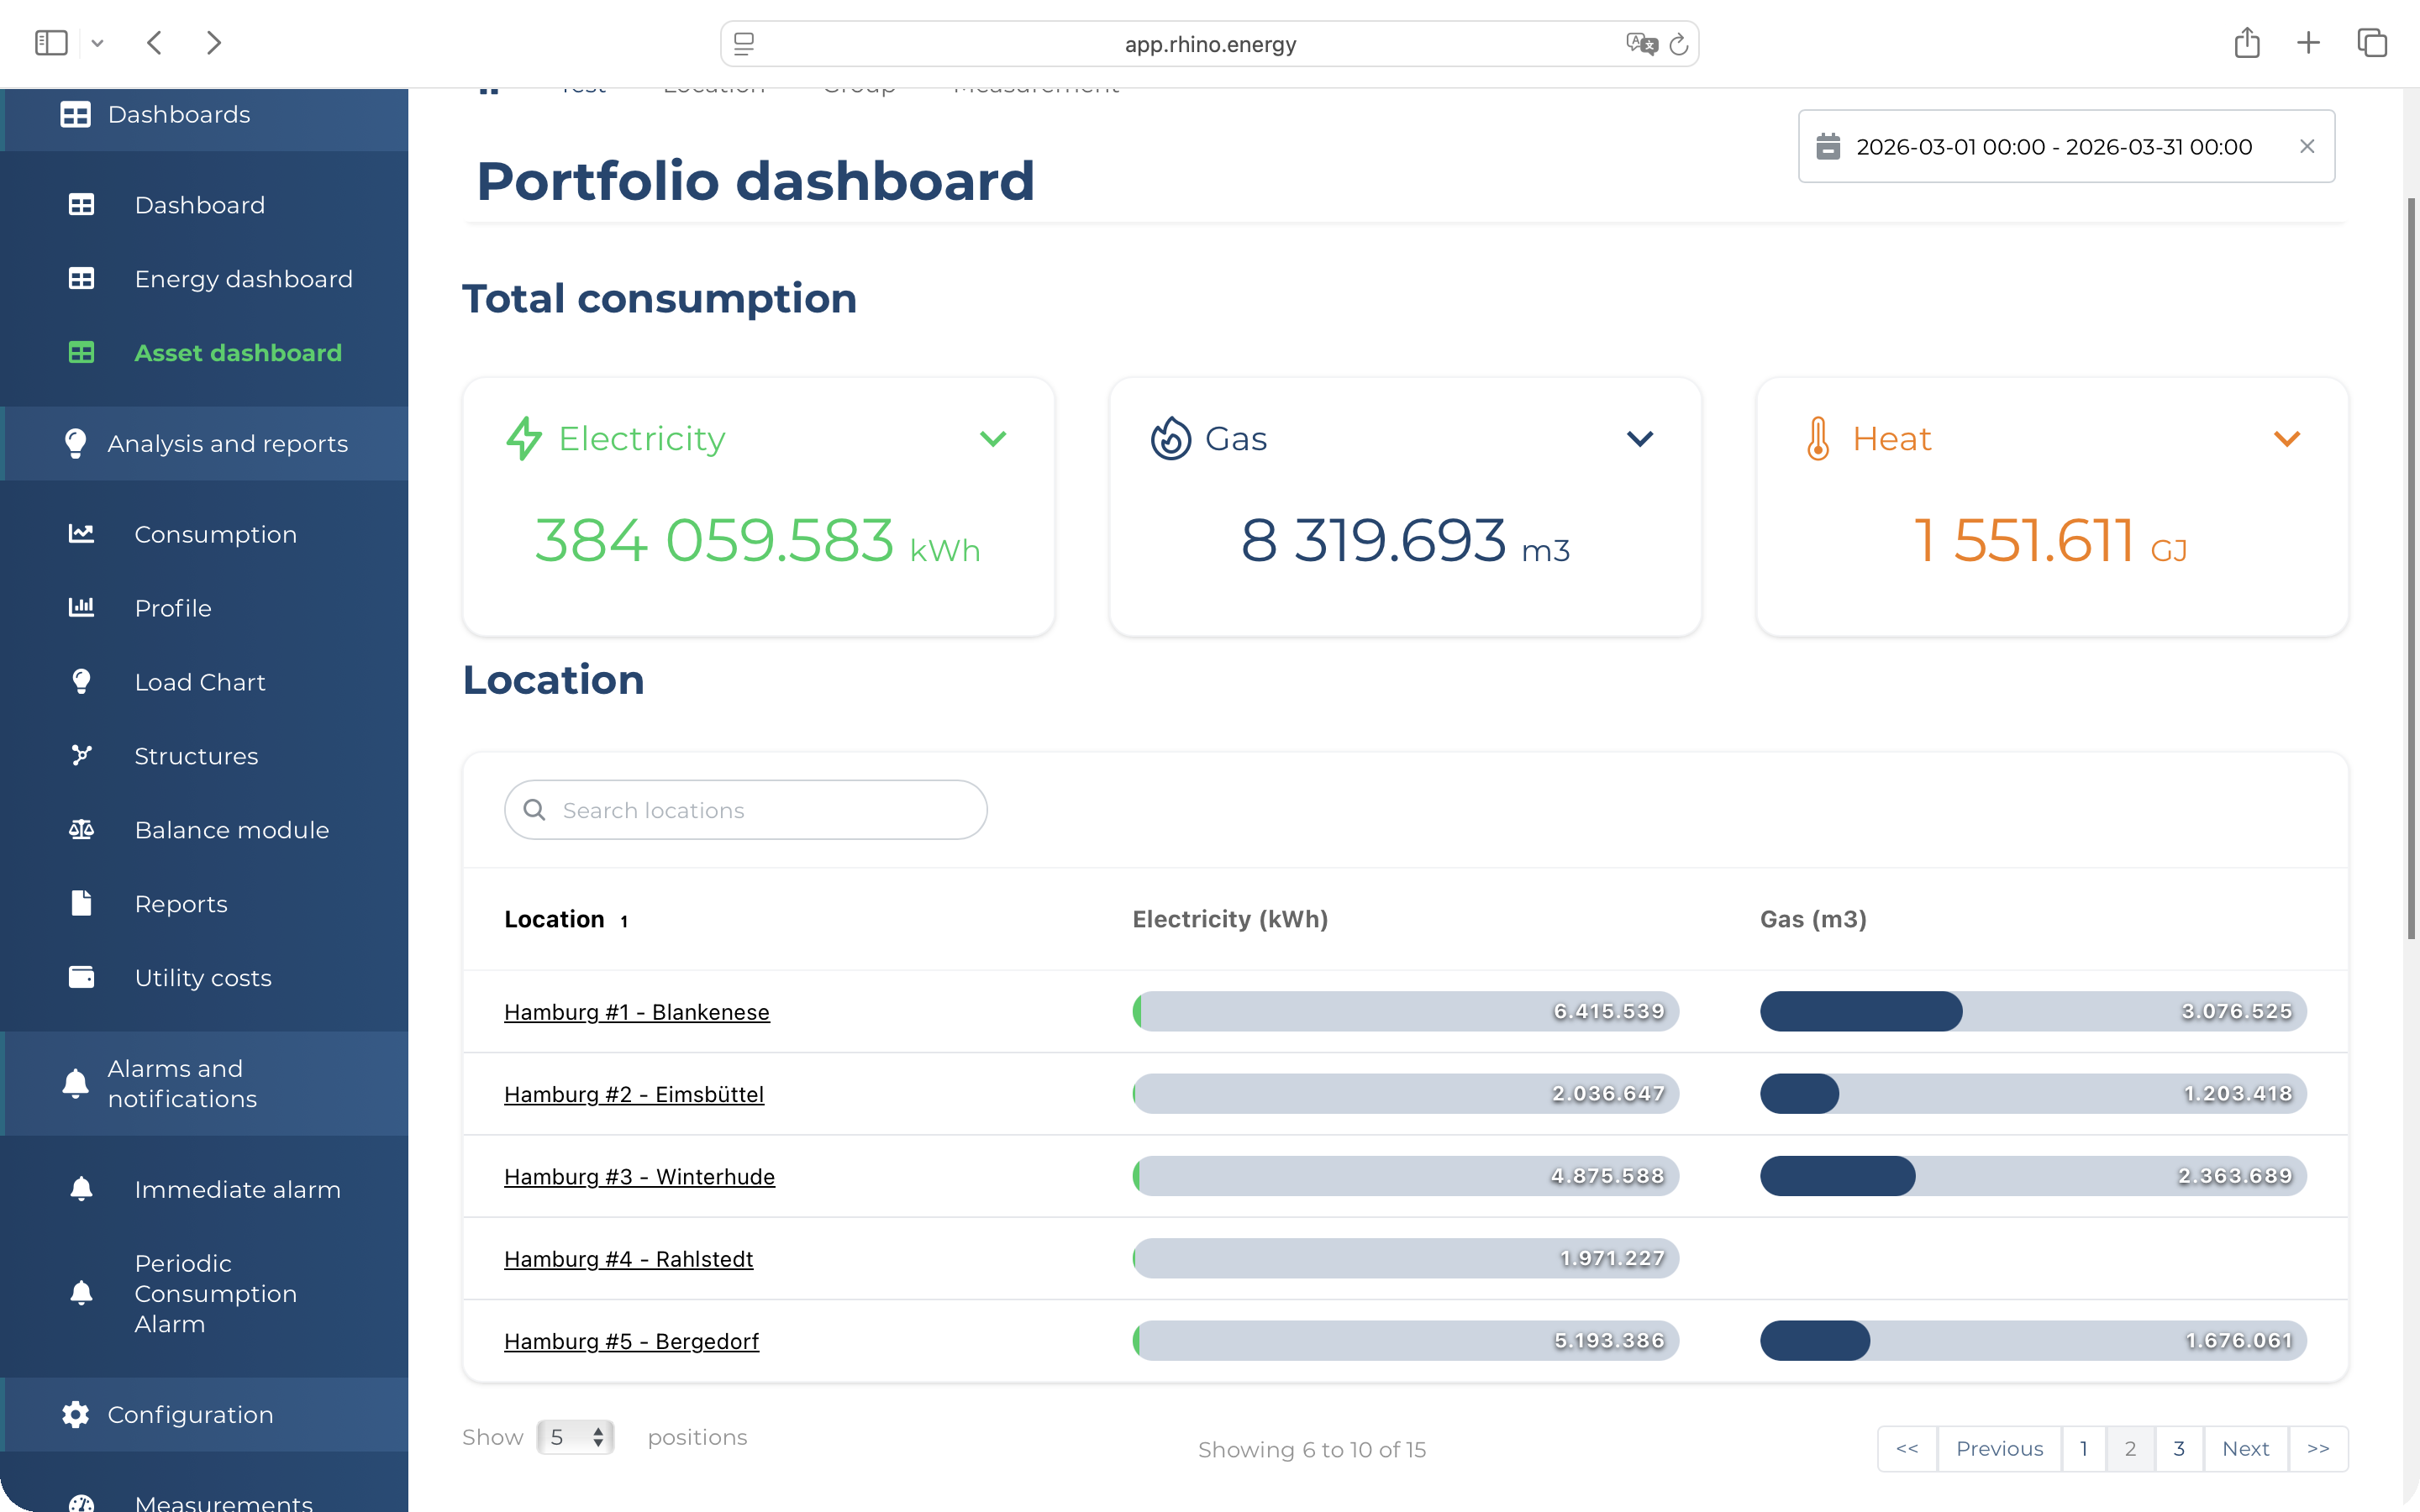
Consumption
See what each gas meter used and when.
Every meter shows 15-minute and daily consumption against a rolling baseline. Compare building to building, heating season to heating season. Spot which boiler circuit is running 30% above its peers and which tenant feeds spike on weekends.
Explore the dashboardAnomaly detection
Gas flowing when nothing should be running.
A meter that keeps climbing overnight when the building is empty is almost always a fault: a valve not closing, a boiler not cycling down, a pilot staying lit. Rhino tracks overnight minimum use per meter and flags what's abnormal.
See how detection worksSubmeter breakdown
Main meter, boilers, tenants: one view.
Map gas flow from the building's main meter through individual boiler circuits, tenant feeds, and common-area systems. The hierarchy shows what's accounted for at each level and what isn't. The unaccounted gap is often where the waste is.
See structure visualizationAlarms
An alert the moment consumption goes wrong.
Set a threshold per meter or per time window. When a gas meter crosses it, Rhino emails you the meter name, building, value, and timestamp. Catch a faulty valve or an uncontrolled boiler before it runs through the week's gas budget.
See how alarms workUtility Connectors
Cloud-to-cloud reads from smart meter networks and utility providers across Europe and North America. No hardware on site.
Rhino Hardware
Small, non-intrusive devices for meters that software can't reach. No rewiring, no downtime, low CAPEX. EU and US certified.
Third Party Infrastructure
Connect via an existing BMS, IoT gateway, or Modbus setup. Adds Rhino to what's already installed. No CAPEX, no replacement required.
What it gives you
Stop guessing. Start controlling.
Three things facility and energy managers do with Rhino gas data from day one.
Heating efficiency
Identify the boilers that cost more than they should.
Efficient and inefficient boilers look identical on a utility bill. You only see the total. Rhino shows consumption per boiler circuit, by period. Compare the same circuit week over week and building to building. Inefficient systems become visible the moment you have per-meter data.
Explore the platformTenant billing
Bill gas by actual use, not estimation.
Shared gas mains allocated by floor area create disputes and overpayment. Rhino's submeter data gives you the exact cubic metres each tenant consumed in any billing period, timestamped, exportable, and defensible if a tenant questions the figure.
See how submetering worksESG reporting
The gas data CSRD requires per building.
Under CSRD and ESRS E1, real estate companies must disclose Scope 1 gas emissions per asset. Rhino captures consumption at meter level and aggregates it to portfolio level, without manual collection runs. Per-building intensity figures and audit trail ready when your ESG auditor asks.
See ESG reporting
Proof
Real gas. Real portfolios.
Residential
449
apartments with automatic gas monitoring across Amsterdam
Bouwinvest · Amsterdam · Electricity, gas, water, and heat tracked per unit. Gas consumption data feeds directly into the portfolio dashboard and CSRD reporting workflow. No manual reads required.
Read the case study
Commercial Real Estate
Gas. Measured.
across a mixed commercial portfolio. Every meter, one dashboard.
Multiple asset types · Boiler submeters, tenant feeds, and common-area systems all connected · Anomaly detection and CSRD reporting active from day one
Talk to our team
Common questions
Gas monitoring, answered.
Rhino connects to gas meters via P1 port (smart meters in the Netherlands and Belgium), wireless M-Bus, Modbus RTU, and pulse-output meters. Most modern commercial gas meters in Western Europe already have at least one compatible interface. For older meters without a smart output, Rhino's hardware team can advise on low-cost retrofit options that keep CAPEX minimal.
Yes. Rhino's meter hierarchy supports any depth of submeter tree: main building meter, individual boiler circuits, tenant gas feeds, and common-area systems all sit as separate nodes. Each node has its own consumption history, alarm thresholds, and reporting logic. You can compare boiler circuits against each other directly to identify which systems are running above expected consumption.
Under CSRD and the ESRS E1 standard, real estate companies must disclose Scope 1 greenhouse gas emissions, which includes direct gas combustion per asset. Rhino captures gas consumption at meter level and aggregates it to portfolio level, producing the per-building intensity figures your ESRS E1 reporting workflow requires. Data is timestamped and audit-ready.
Rhino monitors gas consumption continuously and triggers an alarm when use falls outside expected patterns: overnight consumption when the building is unoccupied, sustained flow during heating-off periods, or sudden spikes above a rolling baseline. Thresholds are configurable per meter and per time window. Most teams identify their first anomaly within the first week of going live.
Yes. If tenant gas submeters are connected, Rhino records each tenant's actual cubic metre consumption per billing period. The data is exportable per meter per period, timestamped and defensible if a tenant disputes the figure. This replaces estimated allocations based on floor area, which routinely lead to billing disputes and recharges.
Further reading
From the Rhino blog.


Gas costs you understand are costs you can cut.
Connect your buildings to Rhino and see every gas meter: consumption, anomalies, and tenant breakdowns in one dashboard. Most teams find their first insight inside the first week.