


Platform
Any meter.
Every building.
One platform.
Electricity, gas, water, and heat across your full portfolio. Submeters included. Refreshed every 15 minutes. Built so you can act on the data without a data team behind you.
Data quality
The data has to be right. First.
Every chart in Rhino starts with one promise. Complete coverage. Direct measurement. Real-time delivery. Without those, the rest is just a dashboard.
Complete
All utilities. Submeters too.
Electricity, gas, water, and heat across every meter on site. Tenants, HVAC, EV chargers, PV, retail common parts, parking. No gaps in the picture.
Accurate
Every read. Automated.
Data flows from smart meters and Rhino hardware straight into the platform. No spreadsheets, no copy-paste, no read errors slipping into the bill. Manual entry is supported for the meters that need it; most portfolios don't.
Real-time
Any granularity.
15-minute intervals by default. That's the industry standard. When a project needs finer or coarser intervals, we tune it. Upload existing historical readings once, and the full timeline lives in the platform the moment you log in.
What you see
Many views. One platform.
The screens AM and energy teams open every day. Built for the operator, not the developer.
Consumption
Stack any meter, any utility, any granularity.
Compare buildings side by side. Switch between bar, line, area, and pie without leaving the chart. Zoom from a year down to 15 minutes in one click.
See it in a demoLoad profile
15-minute kW against a rolling baseline.
The view that surfaces after-hours runs, equipment faults, and runaway loads before the bill arrives. Used most on electricity, available on every meter.
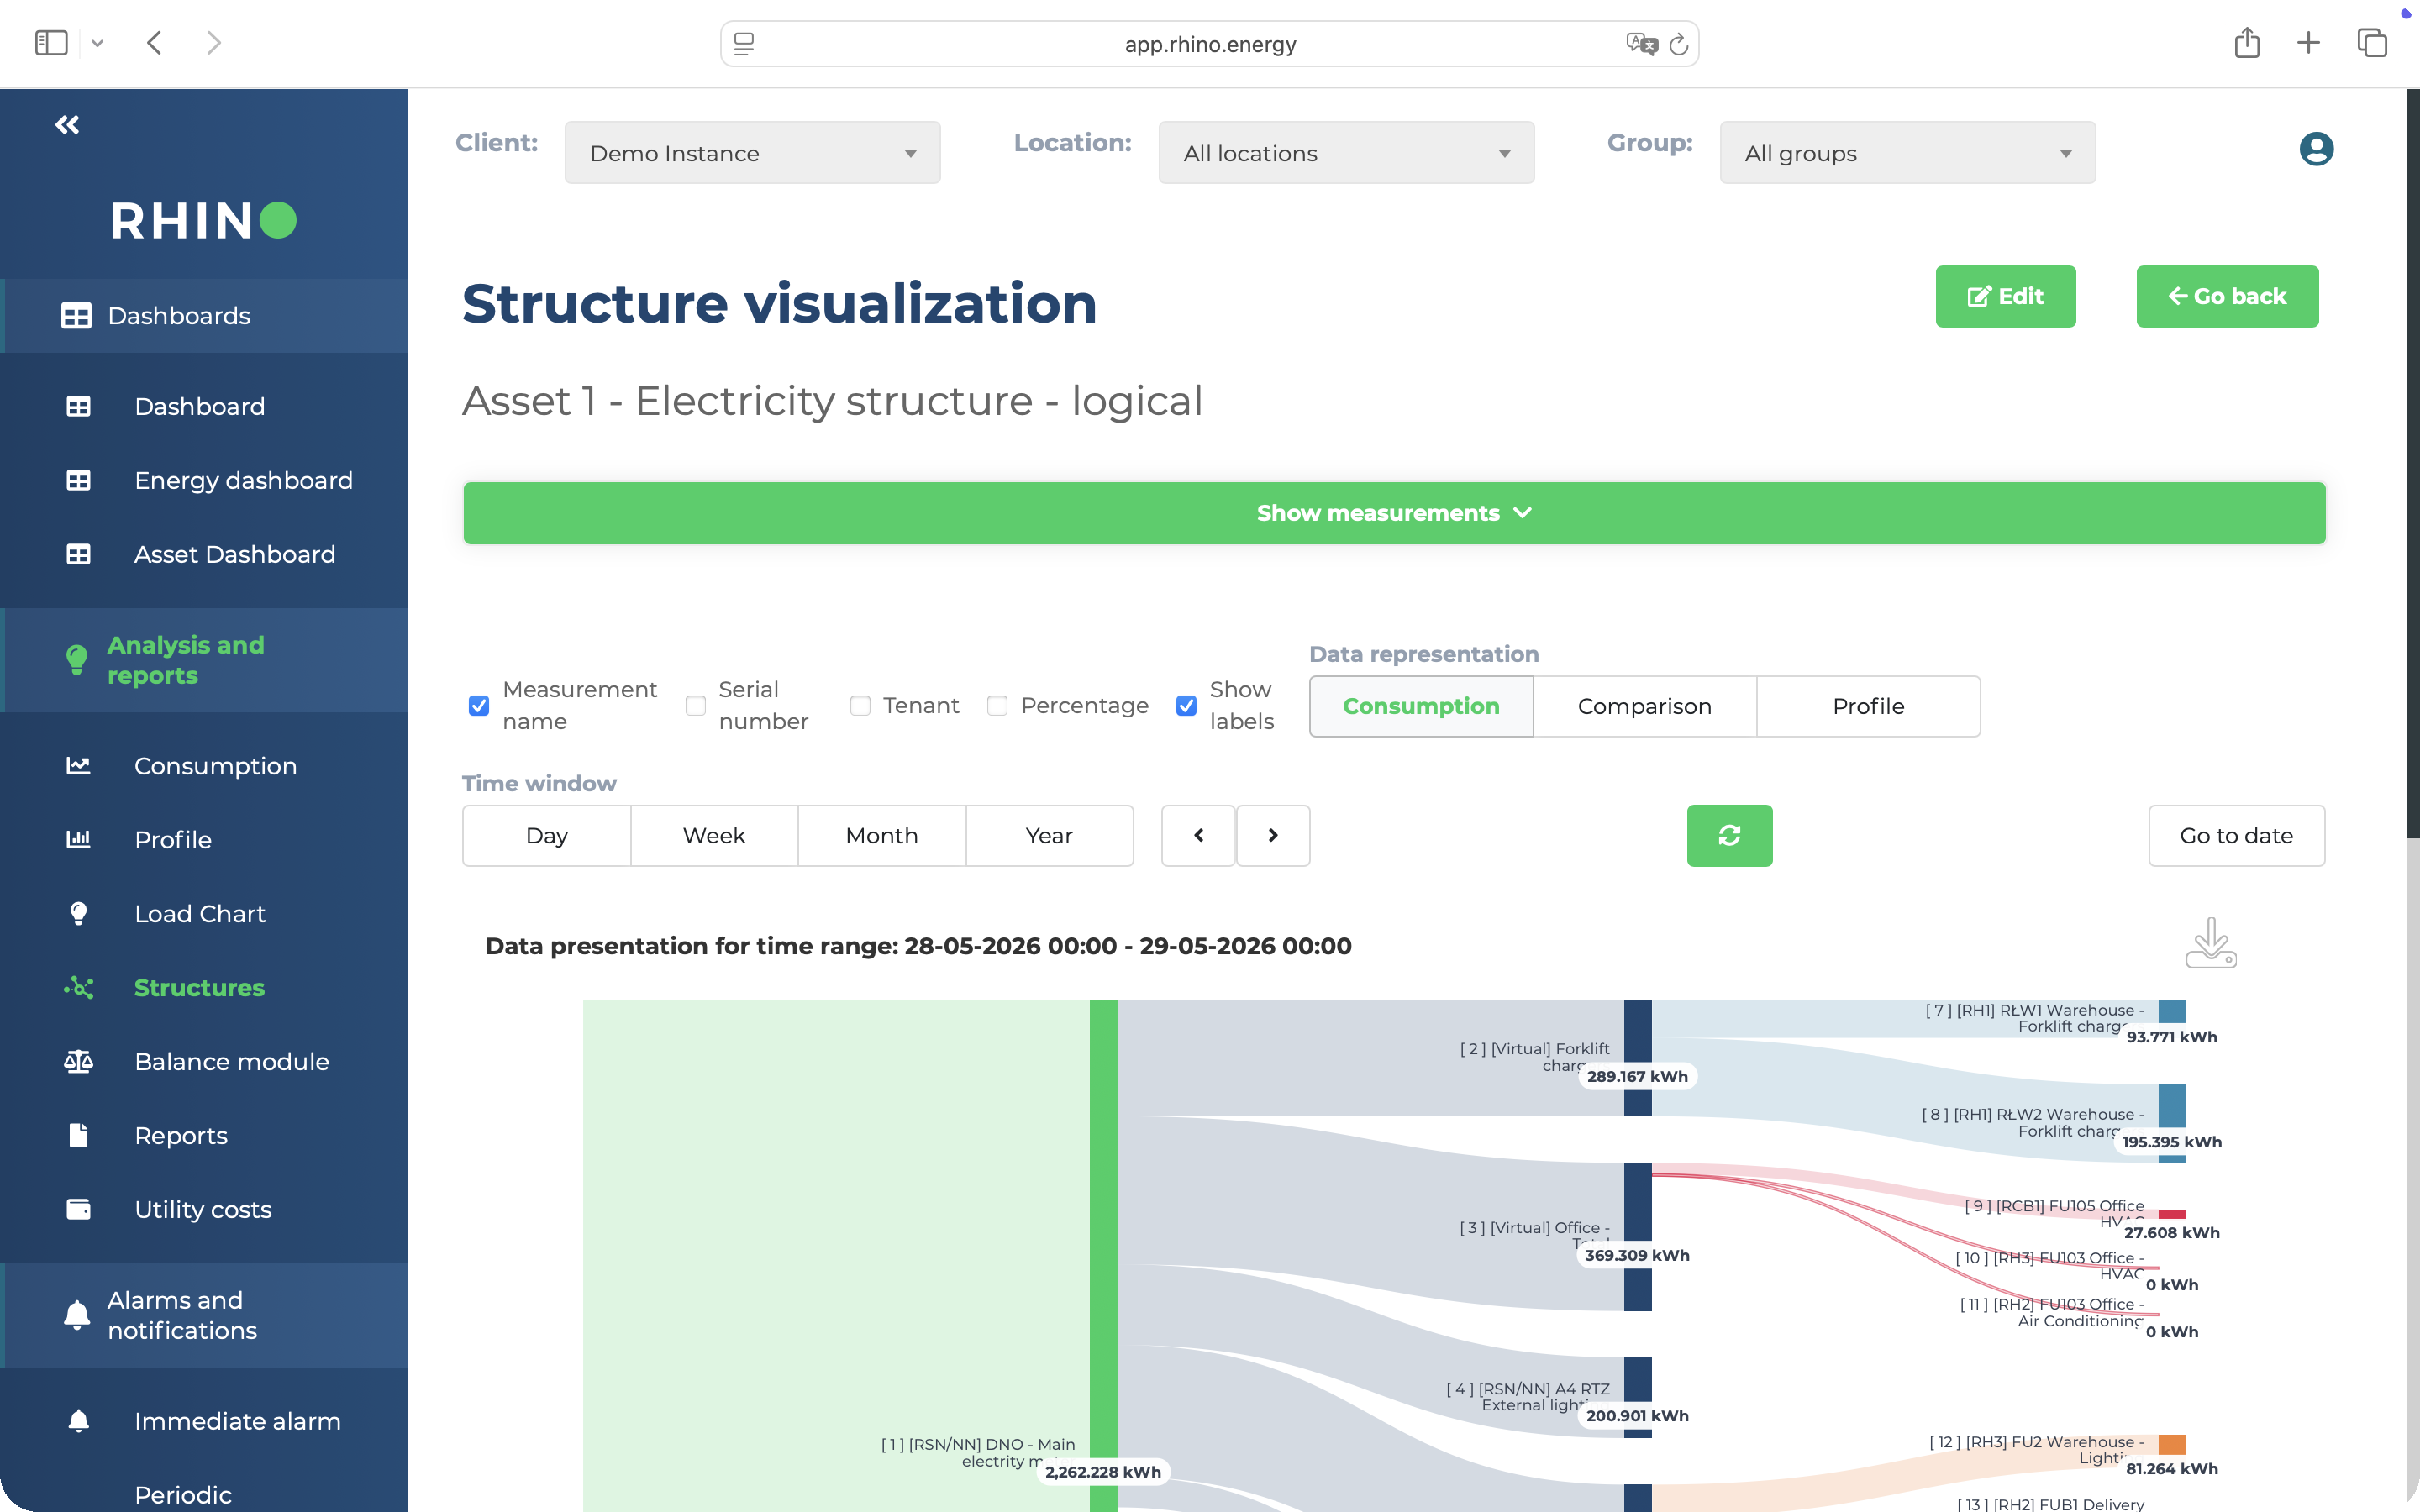
More on electricityStructure
The full energy flow on one screen.
A live Sankey from main meter through every submeter category. Unaccounted consumption surfaced automatically. Click any node to drill straight into the numbers.
See it on a portfolioMeasurement management
Hundreds of meters, organized for one click.
Client, location, group, meter. The hierarchy is yours to define. Save favorite meter sets across buildings and clients so the views you check daily are one tap away.
Talk to our team
What it gives you
Decisions, not spreadsheets.
How AM and energy teams turn Rhino data into decisions on day one.
Anomalies
Catch the shift before the bill.
Compare any period against any other. This week vs. last, today vs. yesterday, December vs. December. When consumption shifts past your threshold, an email arrives with the meter, the location, and the exact percentage.
See alarms in actionStandby load
Find what runs at 3am.
Most buildings have a baseline that never drops to zero. HVAC standby, IT closets, signage. The load profile draws that floor in 15-minute resolution, so what runs after hours stops being a mystery.
Read about standby loadsContract power
Stay under the ceiling.
Contract excesses get billed at premium rates, sometimes for a whole month. Rhino tracks momentary kW against the ceiling in real time. Alarm fires before the limit. Shed load, skip the penalty.
Read about contract powerBenchmark
Compare buildings without exporting first.
Find the worst performers and the buildings setting the bar. Same view, same data, same definitions across every site. No more reconciling four spreadsheets for a board chart.
See a portfolio benchmarkReporting
Hand ESG a clean dataset.
Every chart exports as a structured dataset. Plug it into your ESG platform, your auditor's template, or your CSRD report. Finance and sustainability work from the same numbers.
See the ESG path
How the data gets in
Three paths. No infrastructure overhaul.
Rhino connects to whatever's already in your buildings. Cloud-to-cloud where smart meter APIs exist. Our own hardware where they don't. And via the BMS or IoT gateway you already have on site. Most portfolios use more than one.
Utility Connectors
No installer on site.
Cloud-to-cloud reads from smart meter networks and utility providers across Europe and North America. P1, WMBus, Modbus, direct API. Data in without anyone visiting your buildings.
See utility connectorsRhino Hardware
Where software can't reach.
Our own devices for meters with no remote API: AP, ED variants, AQM, repeaters. Non-intrusive installation, no rewiring, no downtime. Low CAPEX, EU and US certified.
Browse the hardwareThird Party Infrastructure
Use what's already installed.
Connect Rhino via an existing BMS, IoT gateway, or Modbus setup. Adds data collection to what's already on site. No CAPEX, no replacement, no disruption to existing operations.
See third party infrastructureAlready running an ESG platform, billing system, or BI tool? Rhino feeds into them too.
See the Utility Data API
Data flow
From meter to your dashboard.
Every connection path: hardware, utility connector, or third-party infrastructure, feeds into Rhino Cloud. Normalized, structured, and ready to use the moment you log in.
All paths lead here
Rhino Cloud
Every meter. Every path. Complete, accurate utility data in one place. Updated every 15 minutes.
Active in over 40 countries
ESG & billing reports
Dashboard & API access
Click to see inside
Rhino Cloud
From raw reads to reliable data
Normalized & structured
Raw pulse counts and meter reads converted to clean kWh, m³, and GJ records. Gaps detected and flagged automatically.
15-min granularity
Sub-hourly resolution across all utility types. Full history queryable back 7+ years, on demand.
Single unified model
Hardware, API connector, and third-party feeds merge into one schema. One integration, every source.
GDPR compliant
99% uptime
Encrypted in transit & at rest
Click to go back
Rhino Platform
Your data. Your dashboard.
Track consumption across your full portfolio, set thresholds, and generate ESG and billing reports. All utilities, including submeters. No manual exports.
Click to explore
Rhino Platform
Utility coverage
15 min
data granularity
Real-time
threshold alerts
All sites
single portfolio view
Click to go back
Proof
From small portfolios to global ones.
Logistics
1,660
smart meters connected across 24 GLP warehouses
Pan-European logistics portfolio. Electricity, gas, and water monitored across 24 warehouses from a single Rhino dashboard. 160,000+ daily data points. Tenant billing and fault detection without a single manual meter read.
Read the GLP case study
ESG & Sustainability
39%
reduction in utility consumption by participating residents
Bouwinvest · 449 apartments in Amsterdam · Rhino API connected to the Zig tenant app, residents tracked and reduced their own consumption in real time
Read the case study
Energy monitoring
Already running an energy monitoring platform?
Rhino feeds it.
Your existing dashboards stay in place. Rhino connects to your energy analytics platform via the Utility Data API, pushing 15-minute interval readings from every submeter in your portfolio directly into the tool your team already uses. No migration, no duplication, no extra logins.
Common questions
The Rhino platform, answered.
Consumption, load profile, and a structure visualization of energy flow across all utilities: electricity, gas, water, and heat. Including submeter data. The dashboard also shows live parameters per meter, like momentary kW, voltage, current, and power factor. Granularity goes down to 15 minutes, with full historical data available from day one.
Most meters report at 15-minute intervals and the dashboard refreshes live as data arrives. A small number of legacy connections refresh hourly or daily, depending on the source. Those cases are flagged on the meter itself, so you always know what's behind the number you're looking at.
Yes. Wherever a smart meter is already in place, Rhino connects via software only: utility-provider APIs, meter manufacturer feeds, or protocol-level reads. We add hardware only where the meter outputs aren't accessible by software, like older meters, certain submeters, or specific utility setups. Most portfolios run a hybrid setup.
See the full breakdown on the connections page.
Yes. The Rhino API exposes consumption and meter metadata in a documented JSON format, ready for ESG platforms, BI tools, and billing systems. Authentication is token-based. Full spec on the Utility Data API page, with documentation available on request.
A BMS controls equipment inside one building. Rhino monitors utility data across your whole portfolio. They sit at different layers and serve different jobs: a BMS commands what your HVAC does, Rhino reads what your meters report.
Most clients run both. The BMS for control, Rhino for measurement, billing, and reporting.
See your whole portfolio in one platform.
Connect your buildings to Rhino and watch every utility, in every building, in real time. Most teams find their first wins inside the first month.
Related reading
More on utility monitoring.

