


Offices
Office utility data.
Compliant.
EPBD MEPS deadlines and CSRD audit cycles need actuals, not estimates. Rhino turns label compliance into a live operational metric for every building in the portfolio.
Why now
By 2030, the EU's worst-performing 16% of non-residential stock must be renovated. By 2027, national MEPS are in force. The buildings that get measured early get the right capex; the ones that wait get a vacancy risk.
43%
of Dutch offices were still non-compliant at the 2023 Label C deadline
~60%
rental premium for prime certified offices vs older stock (JLL 2025)
75%
asset-level energy data coverage required to fairly represent GRESB intensity


The problem
Three things office portfolios get wrong.
EPBD, CSRD, GRESB and the green-premium gap all trace back to the same root: incomplete utility data at the building level.
Asset Manager · ESG Lead
EPBD MEPS clock is running.
Worst-performing offices face forced renovation or vacancy as 2027 and 2030 deadlines approach. The Netherlands' Label C deadline already passed with 43% of offices non-compliant. Without live consumption data, you cannot know which buildings are at risk and which retrofit investments move the needle.
ESG Lead · Asset Manager
The Scope 3 tenant-data gap is now a GRESB score liability.
From 2026, tenant-controlled emissions in landlord-controlled spaces reclassify into Scope 1 and 2. CSRD ESRS E1 expects audit-grade actuals. Most owners and operators cannot supply them. The gap shows up in GRESB scores and investor reporting before it shows up in lease negotiations.
Asset Manager · Facility Manager
The green-premium spread cannot be evidenced without live data.
Tenants and investors increasingly demand real-time utility transparency. Without sub-hourly consumption data, leasing teams cannot defend the green premium their building should earn. BREEAM In-Use audits, GRESB submissions, and investor roadshows all require the same thing: actual numbers.
How Rhino helps
Data that makes your office portfolio defensible.
Three problems. Three direct responses. All from the same data source.
From annual EPC to live label compliance.
Rhino's submeter interval data shows building-by-building energy use intensity against Label C, B, and A thresholds. Retrofit capex gets targeted to the right asset. You stop guessing which buildings are at risk and start seeing exactly where you stand.
See ESG & ComplianceFull Scope coverage, no tenant chase.
Rhino ingests landlord and tenant utility data via smart-meter APIs and submeters. Output is a clean, audit-grade dataset that feeds GRESB, CSRD ESRS E1, and CRREM without a parallel collection cycle. No more quarterly requests to tenants for consumption spreadsheets.
Tour the platformBuilding performance as a leasing asset.
Live dashboards, BREEAM In-Use evidence packs, and tenant-facing portals via Chainels and HqO turn operational performance into a sales asset for leasing teams. Alarms catch the drift that erodes certified-building performance between audits.
See Cost Reduction
Who uses it
Different roles. Same data.
The asset manager needs a compliance story. The ESG lead needs audit-grade exports. The FM needs building-level alarms. Rhino delivers all three from one data feed.
Asset Manager
Portfolio-wide MEPS visibility and a defensible green-premium story.
Portfolio-wide view of energy use intensity against MEPS thresholds, per-building retrofit prioritization, and a defensible "green premium" story for leasing. Every building ranked. Every risk visible before the next audit cycle.
See Portfolio OperationsESG Lead
Audit-grade data into GRESB, CSRD, CRREM, BREEAM from one source.
Audit-grade, asset-level utility data flowing directly into GRESB, CSRD ESRS E1, CRREM, and BREEAM In-Use, with full landlord and tenant coverage. One clean dataset replaces the patchwork of spreadsheets and estimate-heavy reporting.
See ESG & ComplianceFacility Manager
Live consumption per floor, per system, with drift caught in hours.
Live consumption profiles per floor, per system, with alarms on baseline drift so HVAC and lighting drift gets caught in hours, not in the next quarterly bill. Maintenance moves from reactive to scheduled before the cost lands.
See Cost Reduction
Inside the platform
One platform. All utilities. Every meter.
Electricity, gas, water, heat. Submeter to portfolio. Every meter visible on one dashboard, with alarms, billing exports, and ESG-grade reports built in. The office portfolio view shows energy use intensity per building against label thresholds, so the MEPS risk register becomes a live operational dashboard.
Tour the platform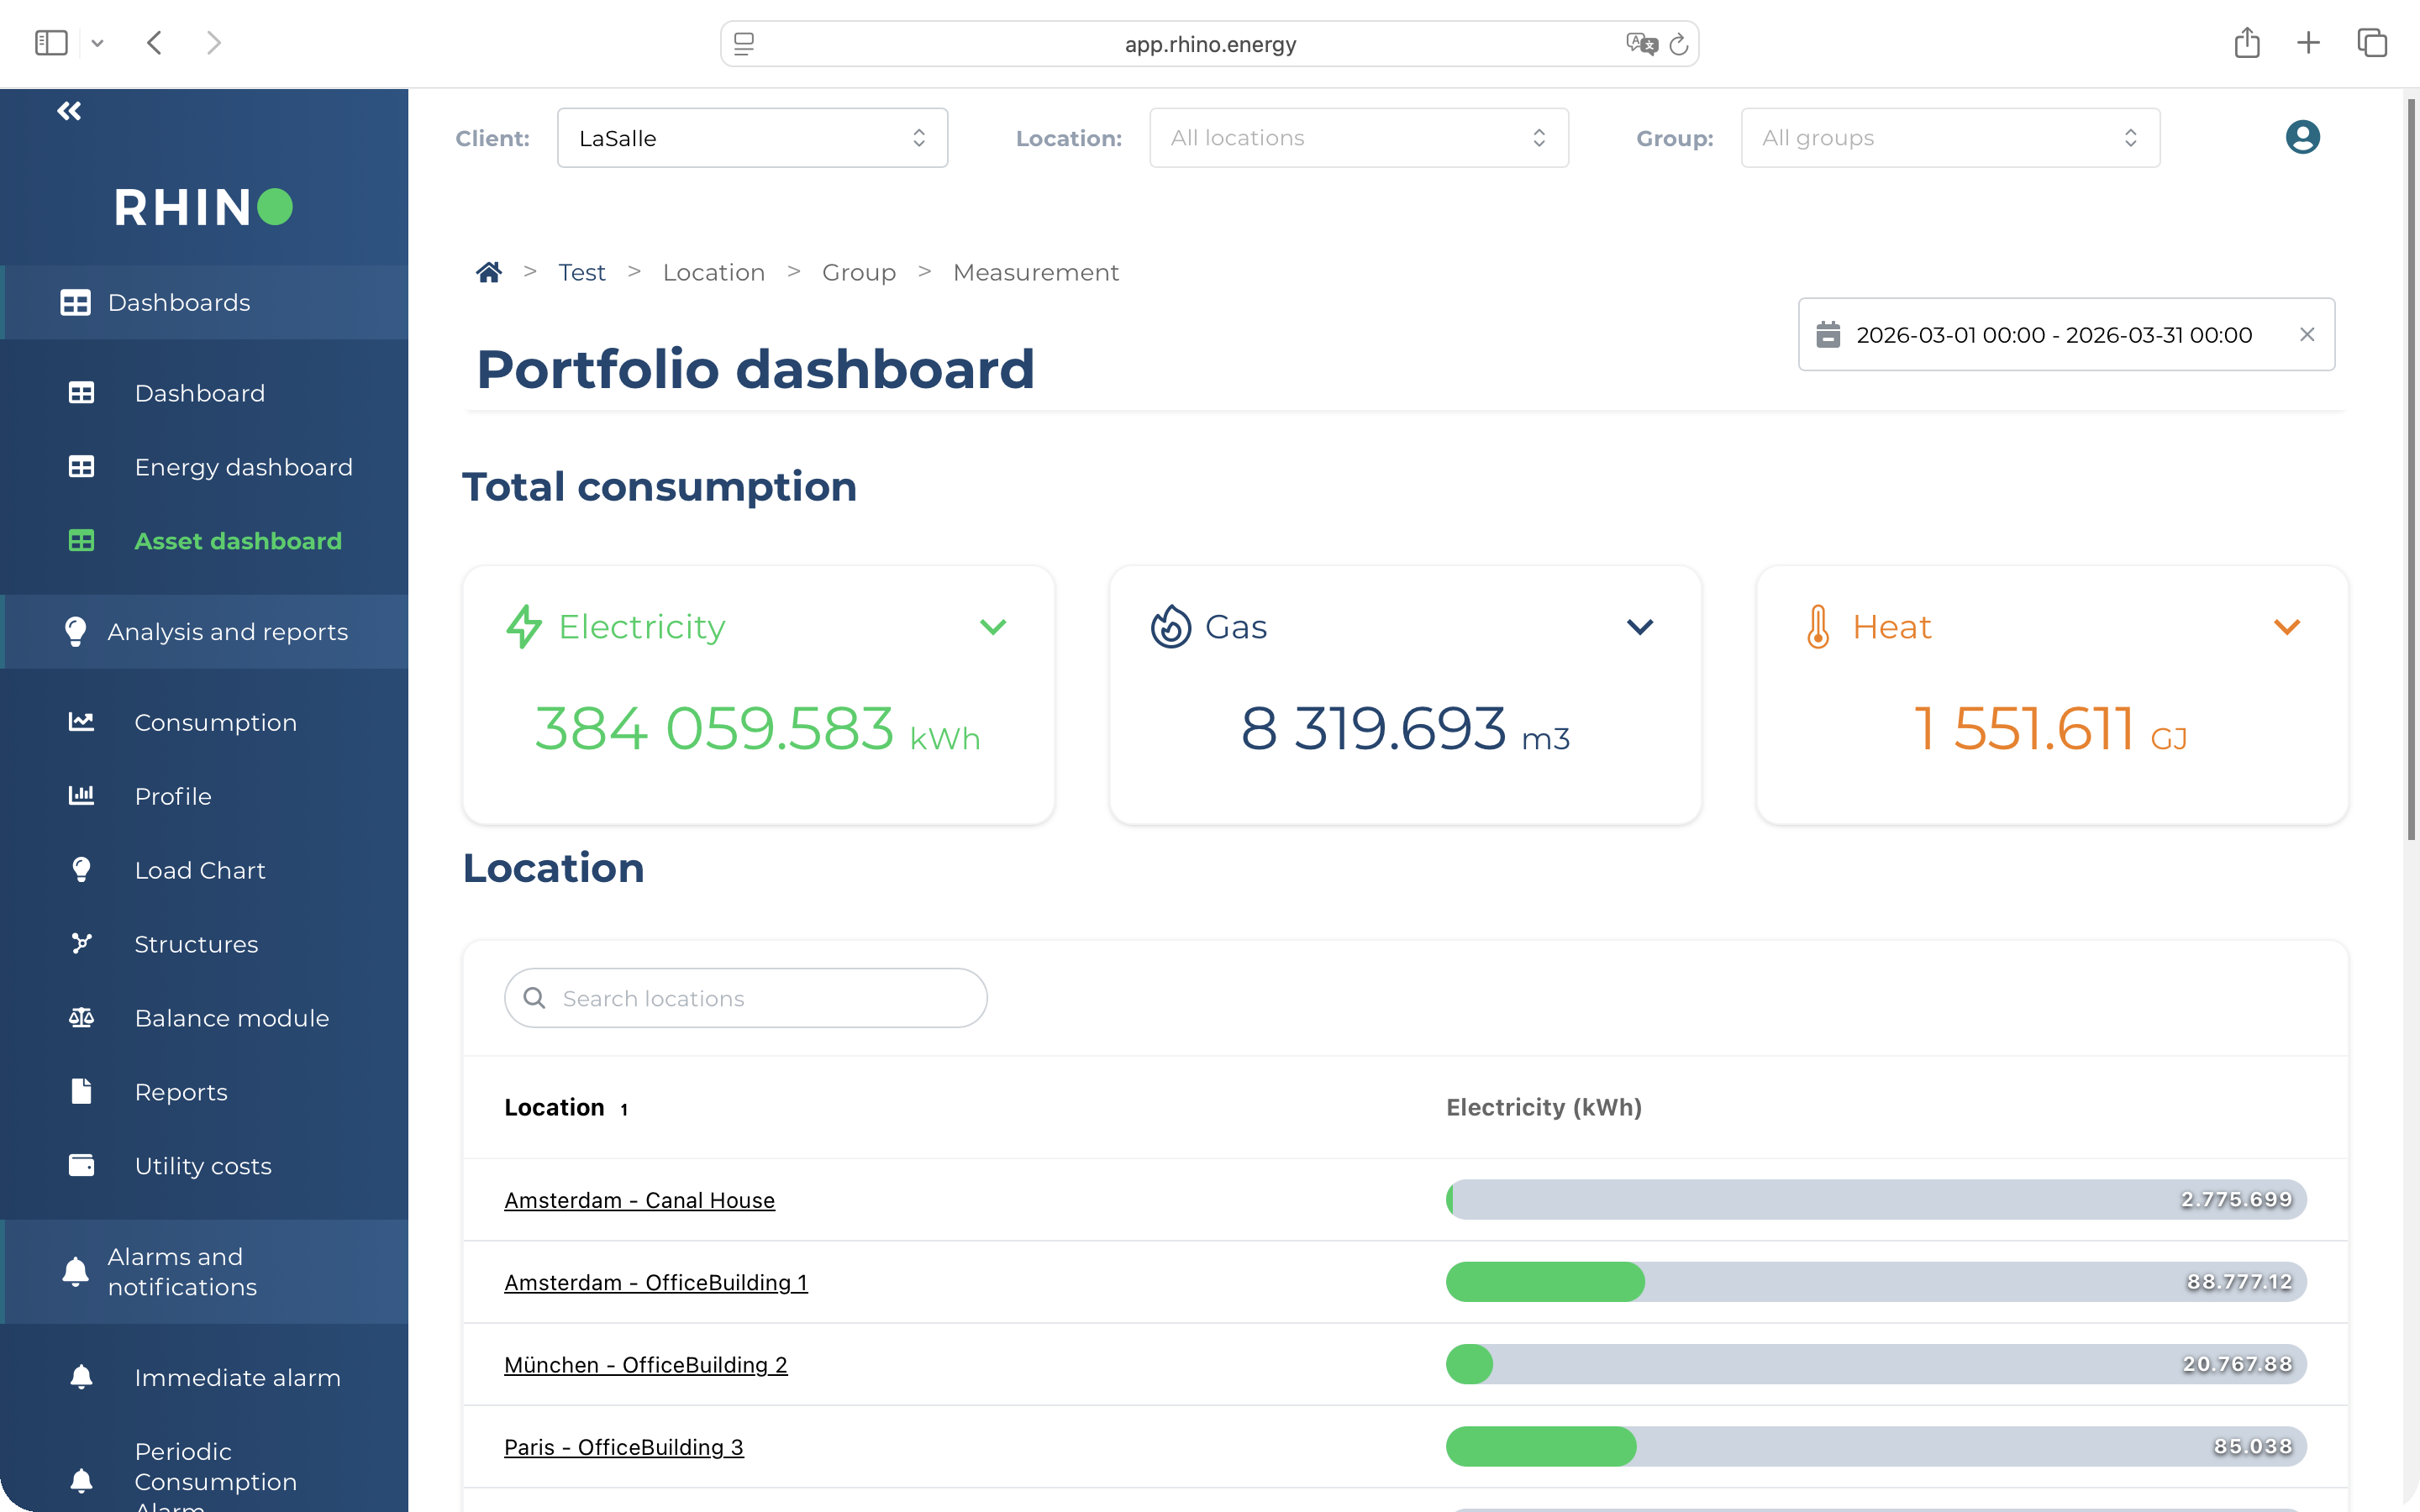
Customers
Office portfolios across Europe.
Asset managers, investors, property managers, and office occupiers rely on Rhino for accurate utility data across their portfolios.
Customer proof
Real results. Real portfolios.
Office investors and asset managers using Rhino across Europe.
Office · Amsterdam · Institutional investor
23%
energy cost reduction in year one
Bouwinvest connected their Amsterdam office portfolio to Rhino via utility APIs and low-CAPEX submeters. Live 15-minute data replaced quarterly bill review. Alarms surfaced building-level faults within hours. ESG reporting cycle reduced from weeks to days.
Read the Bouwinvest case study
Common questions
Office utility monitoring, answered.
Yes. Rhino tracks kWh per m² in real time against every label threshold. The platform shows you which buildings sit where, what is driving consumption, and which retrofits move the label. You stop waiting for annual EPCs to find out where you stand.
Rhino captures landlord and tenant meter data through utility APIs and submeters, produces auditable per-asset exports, and feeds GRESB, CSRD, and CRREM from the same dataset. The data collection cycle that used to take weeks becomes an automated feed. Full CSRD energy data guide →
Yes. Rhino ingests submeter data per tenant, per floor, per system, with consent-led data flows that fit GDPR. Output drops straight into Yardi or your billing stack for accurate allocation. No manual reads, no estimation, no disputes.
Yes. Rhino sits on top of existing BMS infrastructure through our Third Party Infrastructure path. No rip and replace. The existing investment stays in place; Rhino adds the data layer and the analytics on top of it.
Live consumption dashboards, BREEAM In-Use evidence packs, and tenant-facing visibility via Chainels or HqO turn operational performance into something leasing teams can defend in negotiations. The green premium becomes a number, not a claim.
Bring your office portfolio into focus
Your buildings. Your data. Compliant.
See what your portfolio looks like with all utility data in one place. We will walk you through your buildings, your meters, and what reporting looks like the day you go live.
Further reading
From the Rhino blog.

