


Residential
Tenant-held meters,
landlord-level reporting.
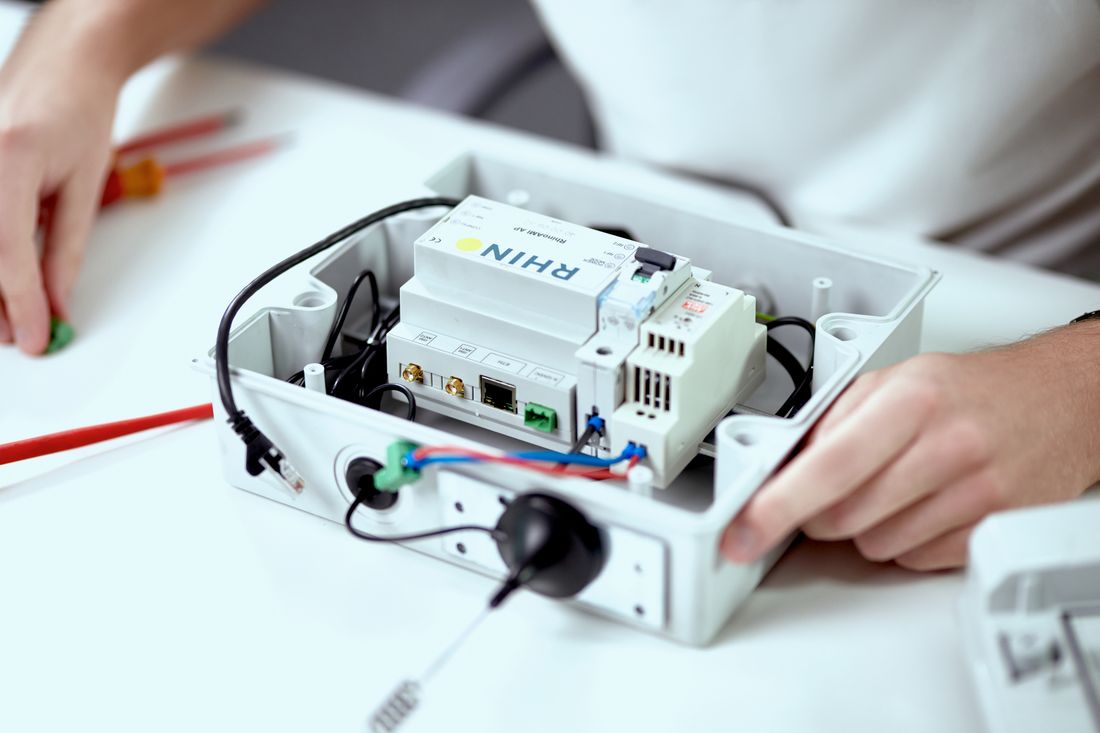
Even when tenants hold the contracts, Rhino reaches the data. Direct utility network connections, GDPR-clean consent flows, no access to tenant spaces required. Per-unit actuals feed straight into your EPBD, GRESB, and billing workflows.
Why now
EPBD requires the EU to cut average residential primary energy use by 16% by 2030. GRESB's 2025 Residential Component brought 239 entities into asset-level scoring on day one. NL and DE service-charge law has tightened. Landlords are accountable for data they often do not own.
16%
EPBD-mandated residential primary energy reduction by 2030
12 months
liability window on every estimated utility service charge in European residential tenancies
10–20%
of water bill typically recoverable when leaks are caught early

The problem
Three layers of the same data access problem.
Tenants hold the meter contract. GRESB gets the estimates. Residents never see their own usage. One platform resolves all three.
ESG Lead · Asset Manager
Tenant-meter data is behind the utility, not the landlord.
In multi-family residential, tenants often hold their own utility contracts. Their consumption sits behind the utility provider, locked to the tenant, not accessible to the landlord. EPBD trajectories and GRESB data requirements put the landlord on the hook for data they have no direct route to. Rhino connects to utility networks with GDPR-clean consent flows and resolves the access gap structurally.
ESG Lead · Asset Manager
GRESB and EPBD reporting runs on estimates, not unit actuals.
Most institutional residential portfolios still submit estimated utility consumption to GRESB because per-unit actuals are locked behind tenant contracts. Estimates push assets below the CRREM target line on paper while real consumption goes unmeasured. The EPC gets a grade. The portfolio gets a GRESB score. Neither reflects what is actually happening at unit level.
Asset Manager · Sustainability Manager
Residents can't act on consumption they can't see.
Behavioral change at scale is a residential-specific decarbonization lever that office and logistics buildings don't have. Residents who can see their own consumption reduce it. Without per-unit data flowing into the platforms residents already use, the lever doesn't exist. At Het Dok in Amsterdam, Bouwinvest connected Rhino data into the Zig app: residents who signed up reduced utility consumption by 39%.
How Rhino helps
Data that makes your residential portfolio manageable.
Three problems. Three direct responses. All from the same data source.
Tenant-meter coverage via utility APIs, with GDPR-clean consent flows.
Rhino pulls tenant consumption from P4 in the Netherlands, SMETS2 in the UK, EDMI and equivalents in Germany with no behind-the-door hardware. Full building energy coverage, CRREM-ready dataset, zero hardware installation in tenant-controlled spaces.
See Utility ConnectorsPer-unit, per-period billing in Yardi and Chainels.
Estimated apportionment becomes metered fact. Bills reconcile against utility invoices automatically. The 12-month challenge window stops being a financial risk and becomes a resolved data feed.
See Tenant Billing & EngagementAnomaly alarms on baseload catch leaks before damage.
15-minute interval data and threshold alarms flag the overnight baseload signature of a slow leak or stuck valve. Maintenance moves from reactive to scheduled before the tenant complaint arrives.
See Portfolio Operations
ESG integrations
Residential utility data, feeding compliance.
Most institutional residential ESG teams already work with Deepki, Measurabl, or Buildingminds. The bottleneck is getting reliable per-unit consumption into those platforms. Rhino is the data layer: connecting to the utility network, resolving the tenant-data access problem, and feeding actuals via API. No manual exports. No estimation.
Deepki is the real estate industry's leading ESG intelligence platform. Rhino is the data source beneath it. Per-unit consumption flows from Rhino's API into Deepki, resolving the tenant-data access problem so your ESG team gets actual figures per unit, not portfolio estimates.
Used by


 and more
Also integrates with

Inside the platform
One platform. All utilities. Every meter.
Electricity, gas, water, heat. Submeter to portfolio. Every meter visible on one dashboard, with alarms, billing exports, and ESG-grade reports built in. The residential portfolio view shows per-unit consumption with GDPR-clean tenant data flows and automatic reconciliation against utility invoices.
Tour the platform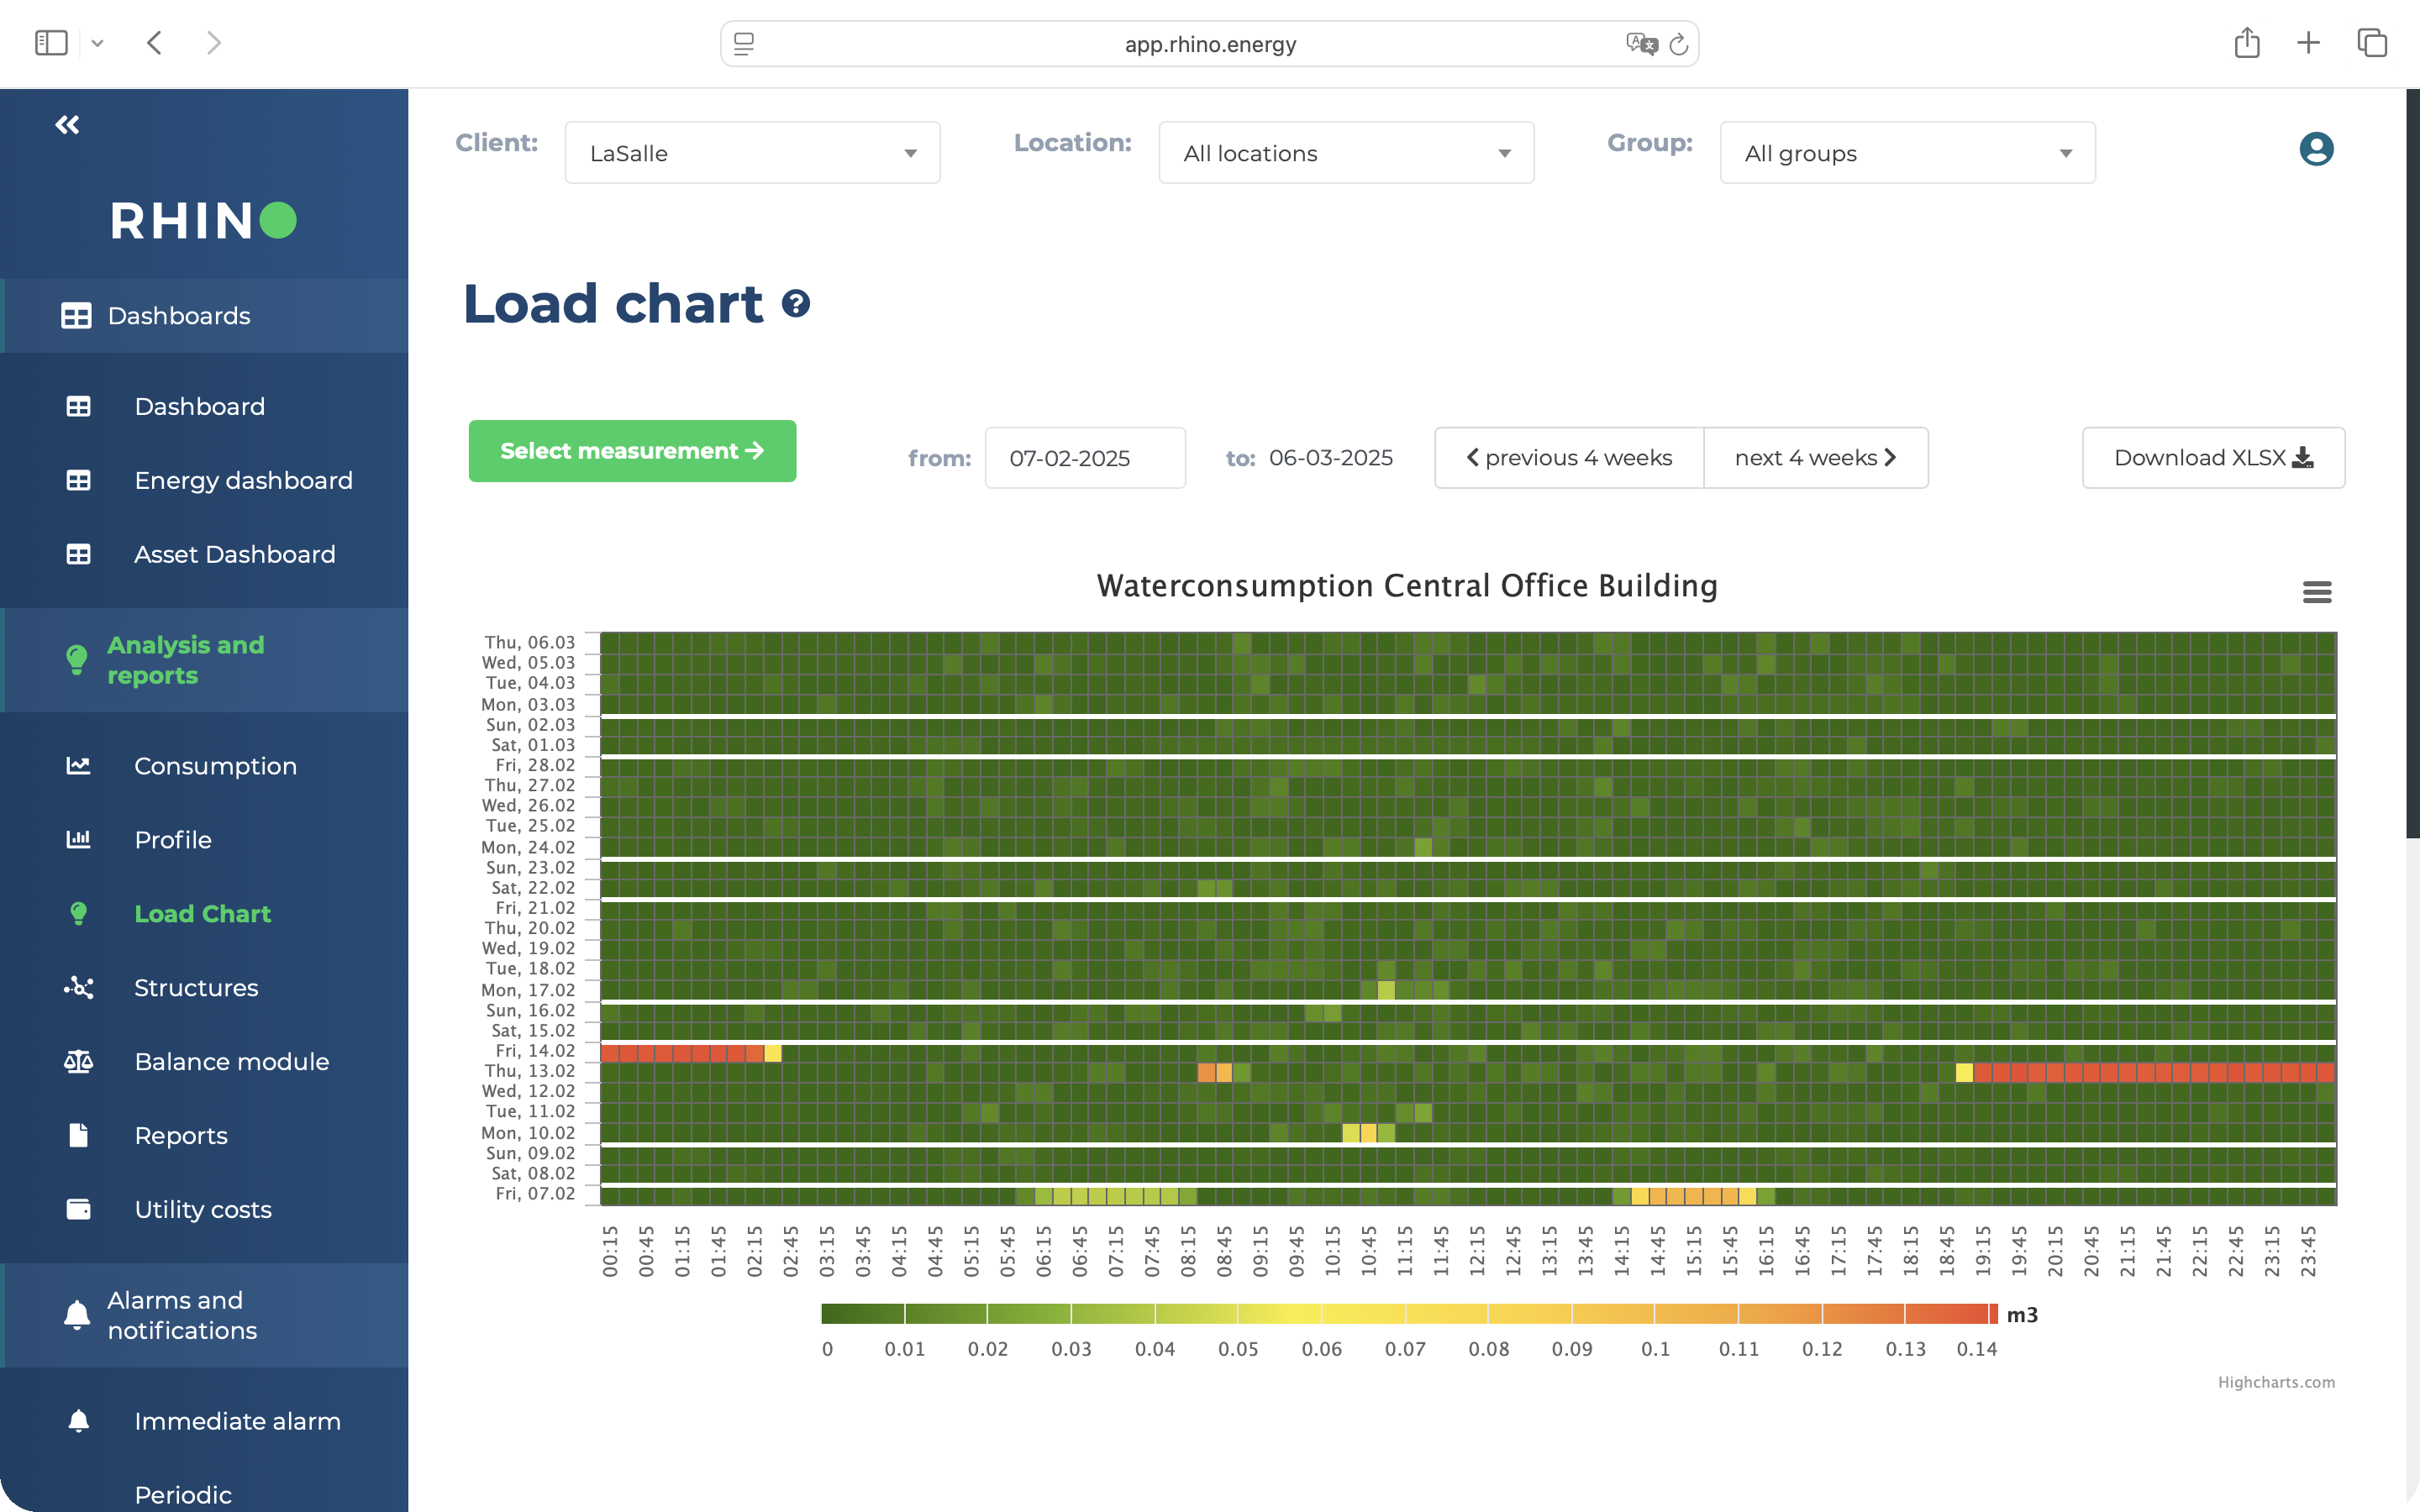
Client
Customer story · Residential
Het Dok. 39% less.
For every resident.
Bouwinvest connected Rhino's per-unit consumption data into the Zig tenant app at Het Dok in Amsterdam. 449 apartments. Residents could see their own usage in real time. Those who engaged reduced their utility consumption by 39%.
Per-unit data via utility API. Rhino pulls consumption for every apartment directly from the Dutch smartmeter network, no hardware installation in tenant spaces.
Live data into the Zig tenant app via API. Residents see their own consumption in the platform they already use, powered by Rhino data and the iqbi engagement layer.
39% consumption reduction. Among residents who signed up. Behavioral change at scale, driven by data visibility, not building upgrades.
449
Apartments at Het Dok
39%
Consumption reduction
API
Data into Zig, no hardware

Bouwinvest
Het Dok, Amsterdam
Customers
Residential, BTR, and PBSA portfolios across Europe.
Build-to-rent operators, PBSA managers, student housing providers, and residential investors use Rhino to automate utility data across their housing portfolios.
From our residential deployments
What the data actually shows.
39%
Utility consumption reduction among residents with live data access, Het Dok Amsterdam
Per unit
Consumption data for every apartment, automated billing, no floor-area estimates
P4
Smartmeter API coverage across the Dutch residential market, no hardware in tenant spaces
Common questions
Residential utility monitoring, answered.
Yes. Per-unit, per-period consumption flows into Yardi and tenant platforms like Chainels. Billing sits on actuals, reconciled against utility invoices automatically. Estimation-based service charges and their disputes become a historical problem.
Yes, through utility-network APIs with GDPR-clean consent flows. P4 in the Netherlands, SMETS2 in the UK, equivalent paths in Germany and Belgium. No behind-the-door hardware installation in tenant-controlled spaces.
Yes. Heat is one of the utilities Rhino monitors, with submeter and allocator support across major brands. Heat allocation per unit feeds the same billing and ESG reporting stack as electricity, gas and water.
Rhino tracks asset-level primary energy use against EPBD trajectories and shows which buildings drive portfolio averages, so retrofit capex gets targeted to the buildings most at risk. You stop guessing where to invest.
Yes. Threshold alarms on overnight baseload catch the signature of slow leaks and stuck valves before they hit a tenant complaint or a damages claim. Maintenance moves from reactive to scheduled.
Bring your residential portfolio into focus
Your buildings. Your data. Automated.
See what your portfolio looks like with all utility data in one place. We will walk you through your buildings, your meters, and what reporting looks like the day you go live.
Further reading
From the Rhino blog.

