
Utility data automation
Every meter read.
Without anyone reading it.
Rhino automates the whole chain: reaching the meter, collecting the readings, validating them, and delivering them wherever your team works. Electricity, gas, water, and heat, including submeters, every 15 minutes. Rhino builds both the hardware and the platform that do it.
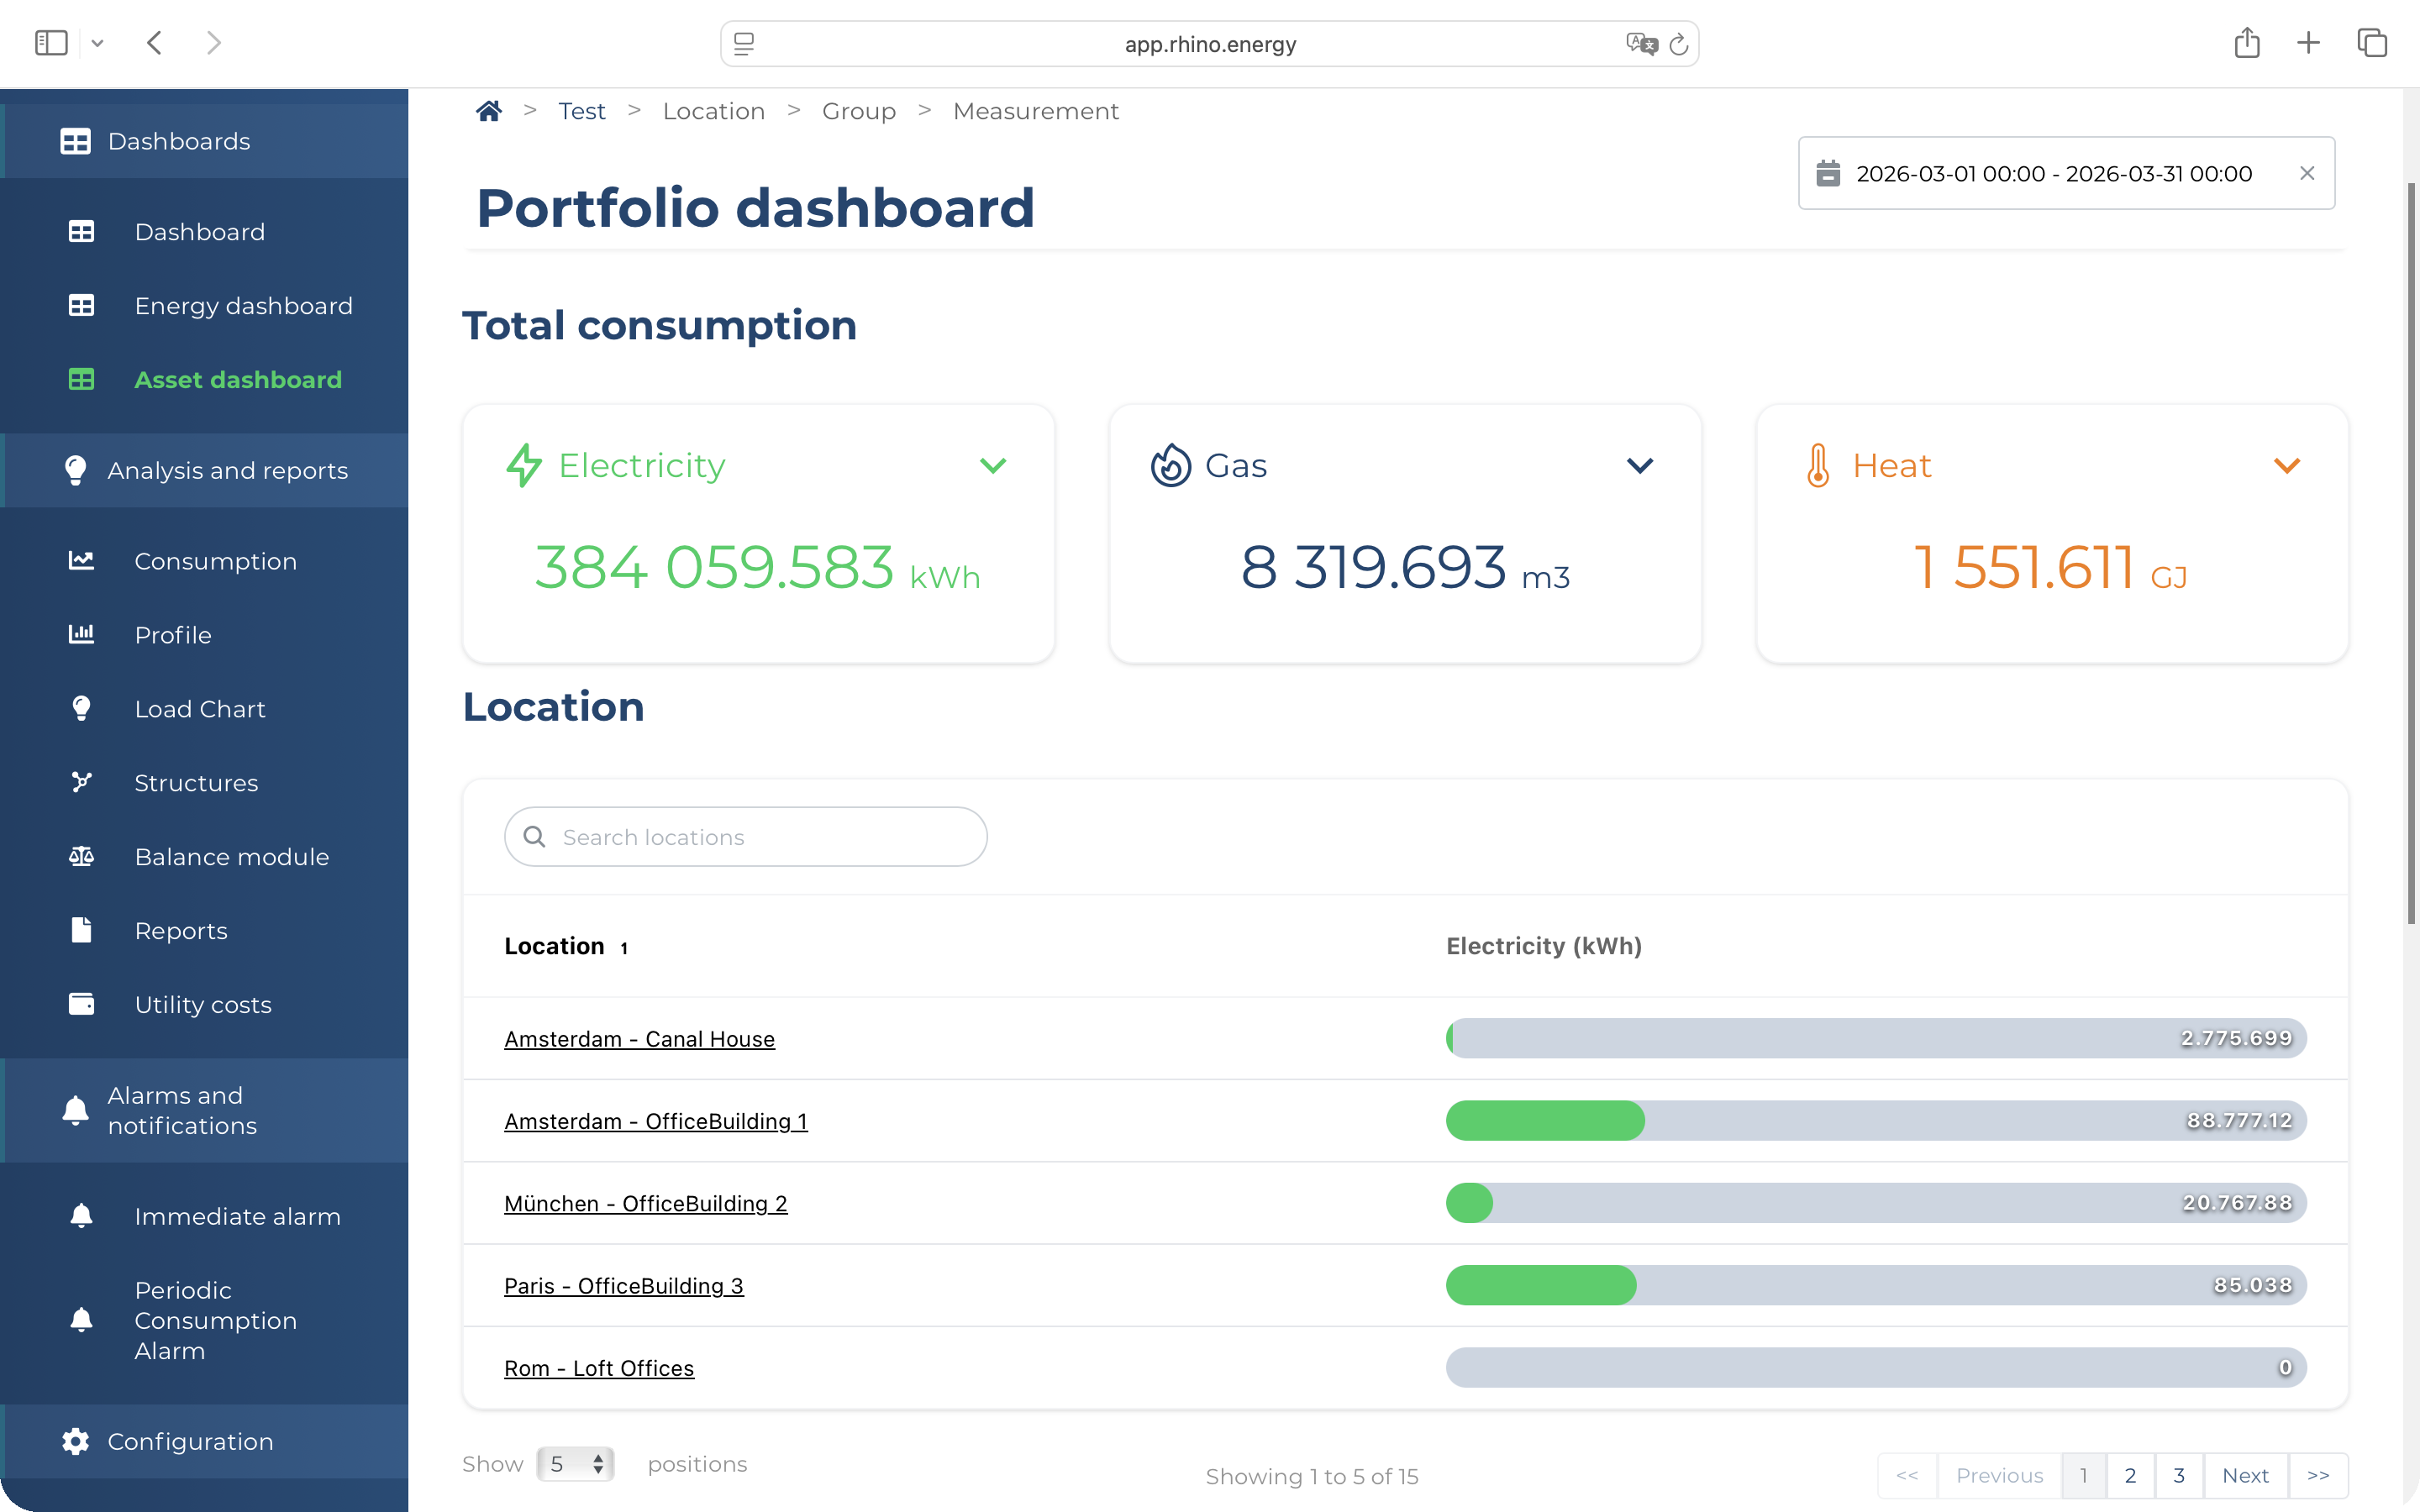
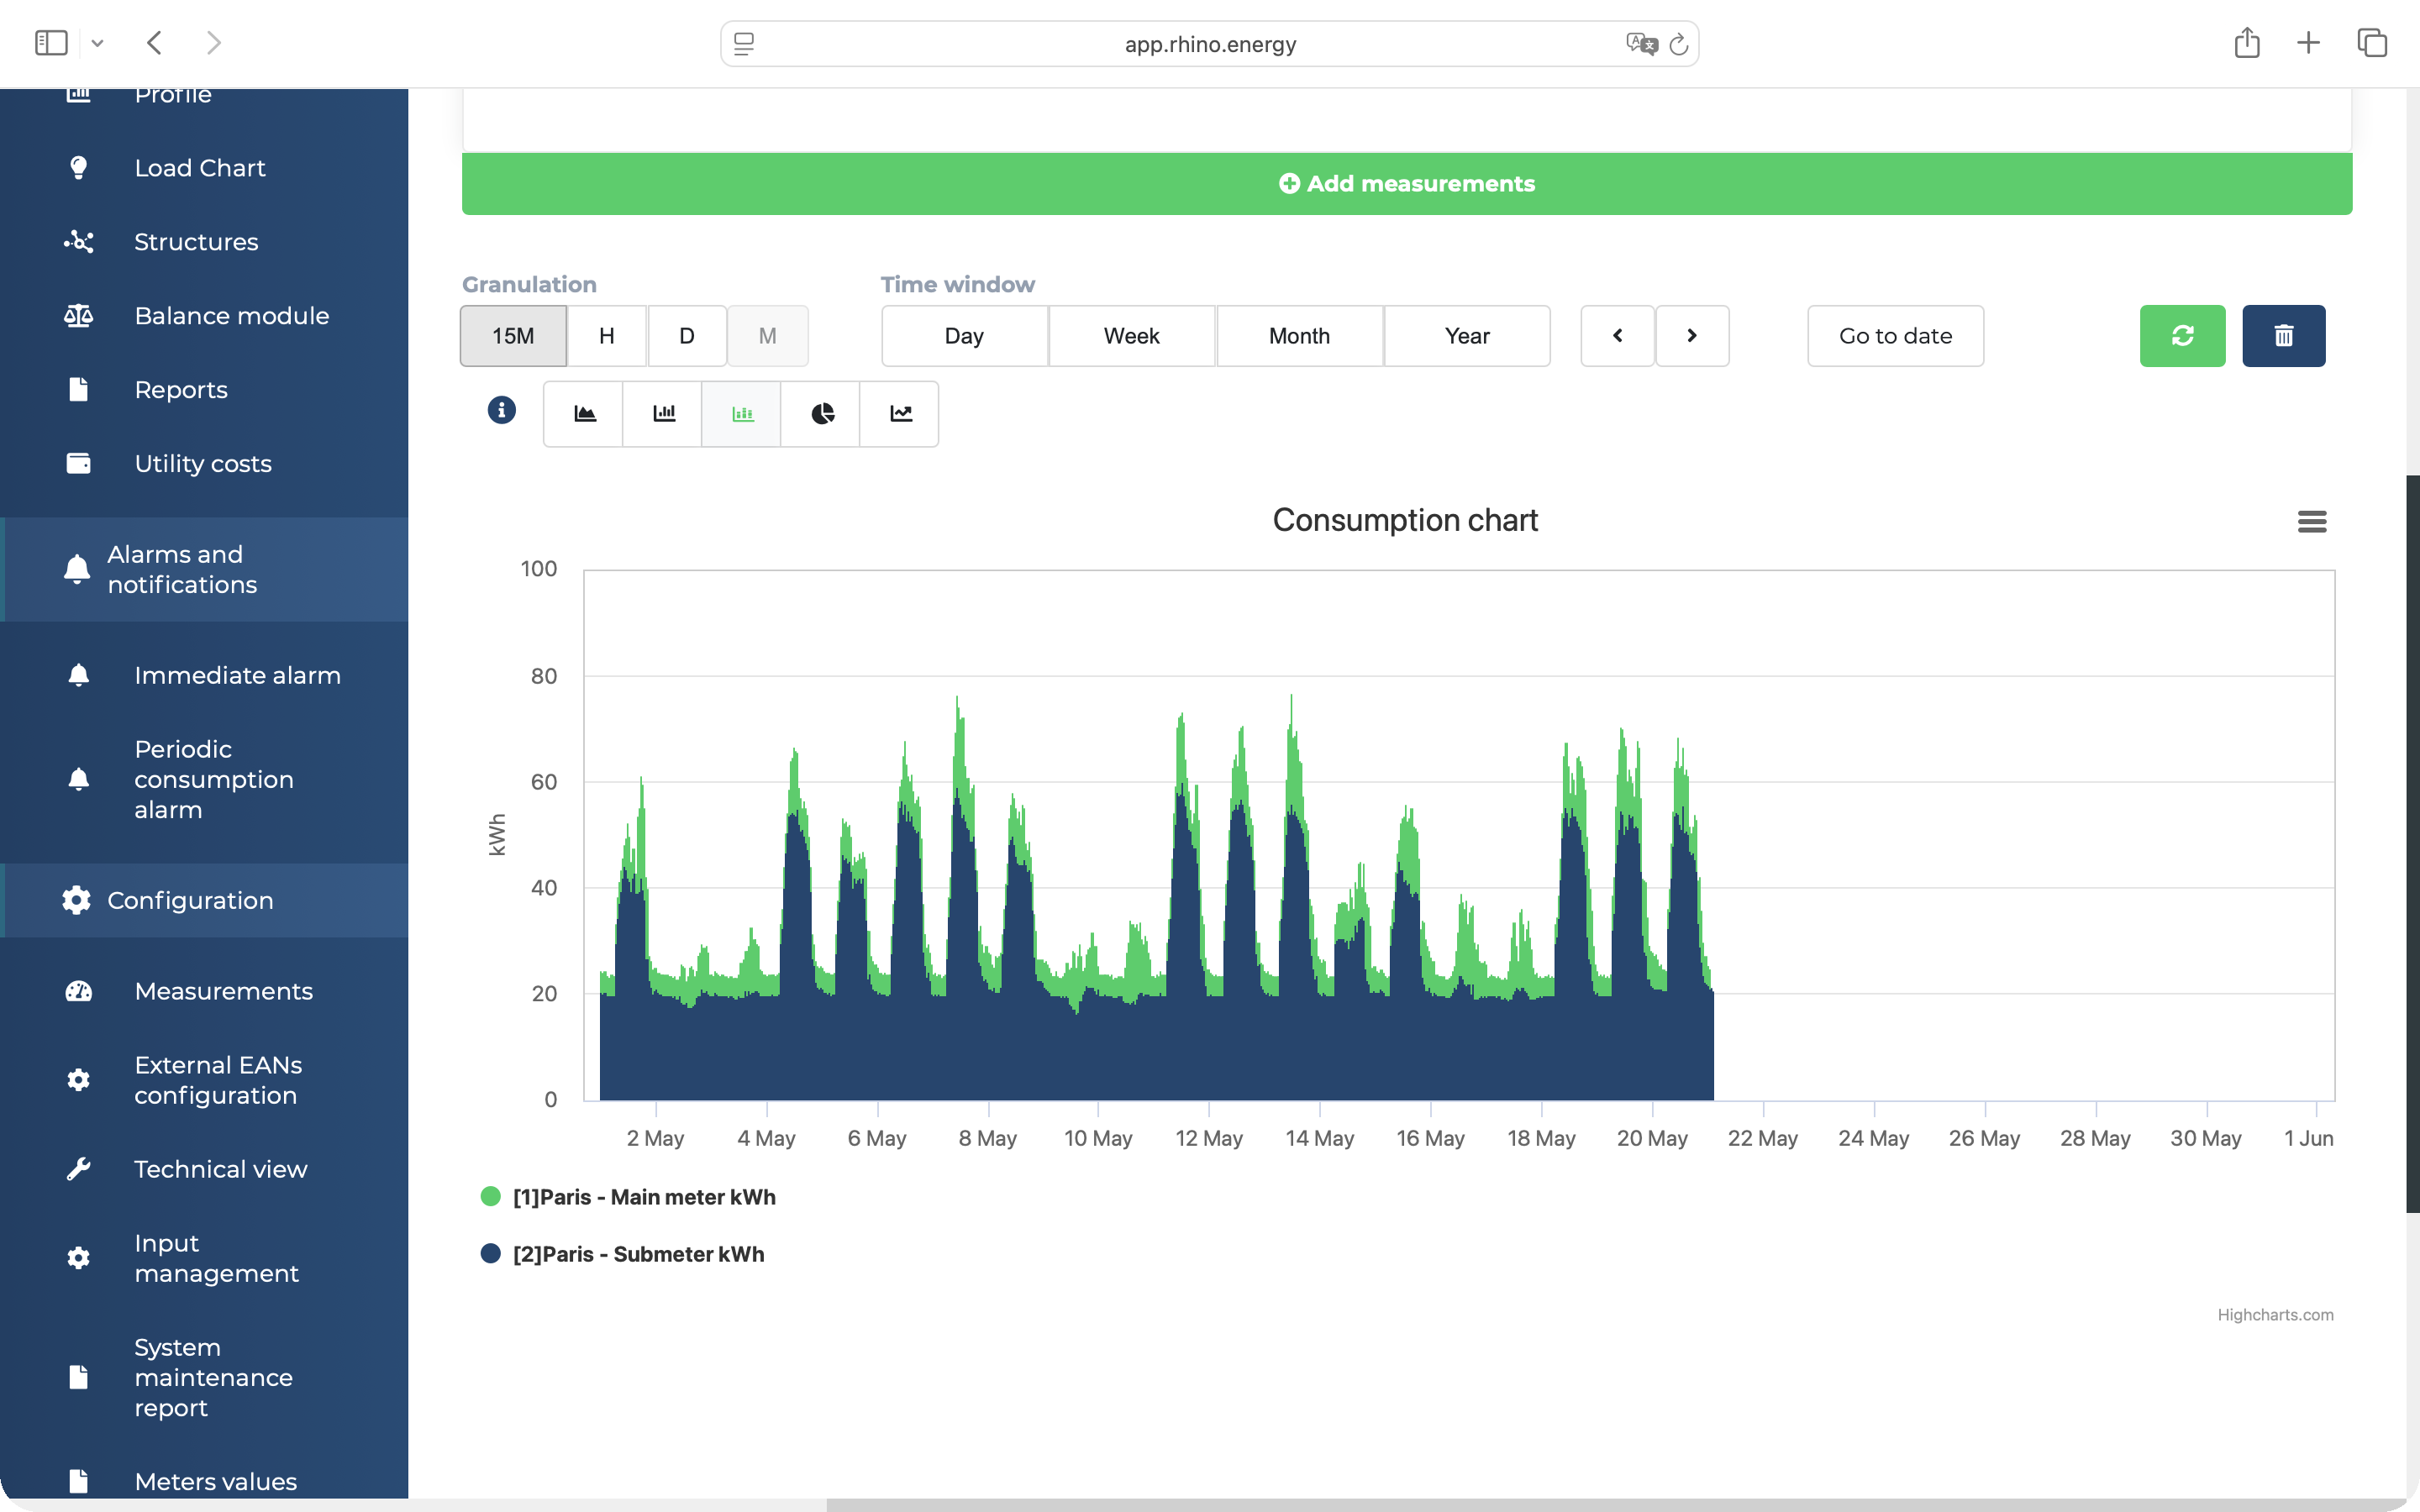
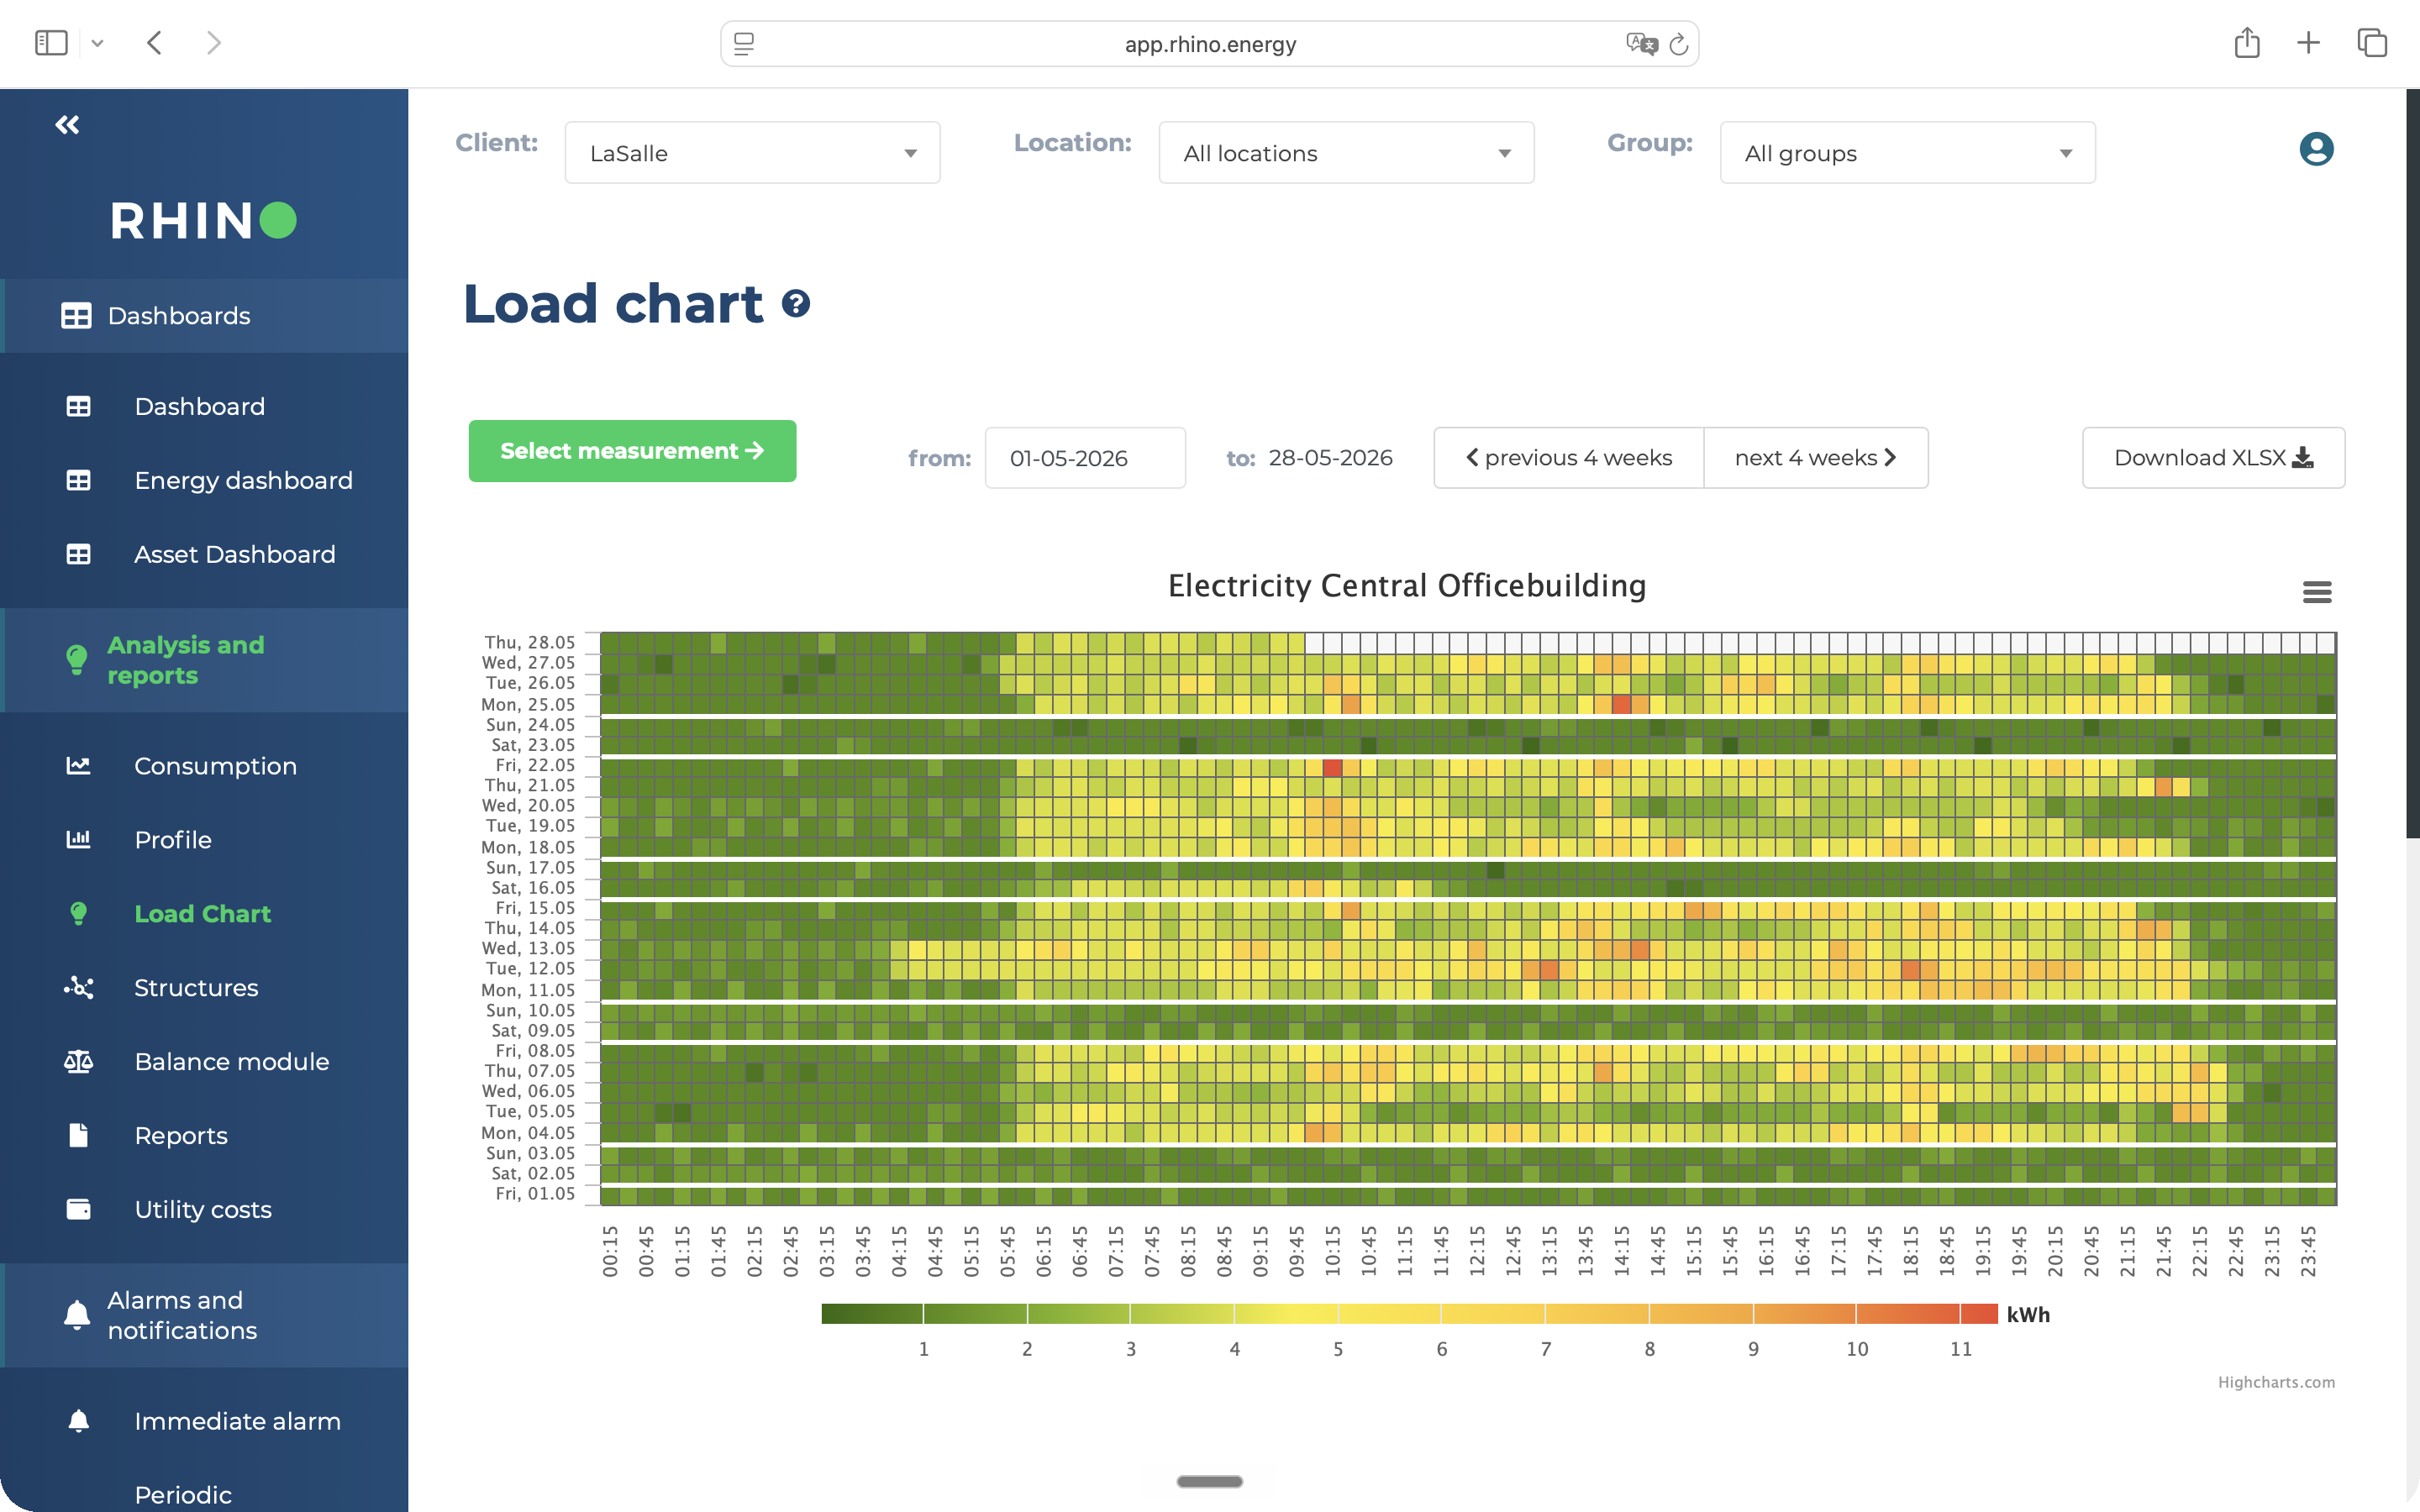
15 min
Collection interval, running without anyone starting it
All utilities
Electricity, gas, water, and heat, including submeters
40+ countries
Meters automated across portfolios worldwide
Zero site visits
Once a meter is connected, no one goes back to read it
The definition
Utility data automation, defined.
Utility data automation is the collection of meter readings without manual intervention: no site visits, no portal logins, no spreadsheet entry. A connection is made once per meter, and readings arrive on a fixed interval from that point on. In commercial real estate it covers electricity, gas, water, and heat, including the submeters that measure consumption at tenant, floor, and circuit level.
The word that matters is automation, not monitoring. Monitoring describes looking at data. Automation describes how the data got there in the first place, which is the part that breaks. A portfolio can have a dashboard and still be running on quarterly reads typed in by hand.
Collected, not requested
Nobody emails a property manager for a reading. The meter is connected once and reports on its own schedule from then on, whether or not anyone is watching.
Validated before it lands
Missing intervals, stalled meters, and impossible jumps are caught at ingestion. What reaches your report has already been checked, so a gap surfaces as an alert rather than as a wrong number.
One format, every source
A Dutch grid operator API, a Modbus submeter in Warsaw, and a BMS in Frankfurt arrive in the same shape, with the same timestamps and the same units. The differences stay in the building, not in your data.
What it replaces
The manual baseline is still the industry default.
In most portfolios, utility data still arrives because a person made it arrive. Someone walks a meter room with a phone camera. Someone logs into four supplier portals and downloads four different CSV layouts. Someone emails a tenant for a reading and waits. Someone retypes all of it into a workbook that one analyst understands.
That process does not fail loudly. It produces a number every quarter, so it looks like it is working. What it actually produces is a figure nobody can trace back to a meter, arriving too late to change anything, with estimates quietly filling the buildings that were missed. Automation removes the person from the loop, which is what makes the number defensible.
See what the platform does with the data96×
readings per meter per day at 15-minute intervals, against one reading a month from a manual read
Traceable
every figure links back to the meter and timestamp it came from, which is what an auditor asks for
No estimates
a building that cannot be reached is visible as a gap to close, not silently modelled into the portfolio total
How it works
Three ways in. Whatever the building has.
Automation only counts if it reaches every building, including the old ones. Rhino connects three ways and most portfolios use more than one. Nothing gets ripped out, so the capex question does not block the data question.
Rhino hardware
For meters with no digital route out. One access point per building, expansion devices on pulse, Modbus, RS485, RS232, and wireless M-Bus. Rhino designs and builds these devices, which is why an unusual meter is a configuration job rather than a dead end.
See the hardwareUtility provider connectors
Where a smart meter already reports to a grid operator or metering company, Rhino collects it over a certified API, cloud to cloud. No hardware, no site visit, no install window to negotiate with a tenant.
See connected providersThird party infrastructure
Where a BMS, IoT gateway, or submetering system is already installed and already reading meters, Rhino takes the data from there. The equipment stays. The manual export step goes.
See supported systems
From meter to report
What automation actually delivers.
Four steps run continuously once a meter is connected. None of them needs a person, and all four have to hold for the number at the end to be worth anything.
1
Connect once
The meter is reached over whichever route the building allows: Rhino hardware, a provider API, or a system already installed. This is the only step with an install date attached to it.
2
Collect on interval
Readings arrive every 15 minutes, per meter and per submeter, across electricity, gas, water, and heat. The schedule does not depend on anyone remembering it.
3
Validate and standardise
Gaps, stalls, and impossible readings are flagged at ingestion. Units, timestamps, and meter identities are normalised so buildings in different countries can sit in the same total.
4
Deliver where you work
Into the Rhino platform, or straight out over the API into the ESG, reporting, or property management system your team already uses. The data does not have to live where it was collected.
Where Rhino sits
Rhino builds the layer others build on.
Utility data automation is a supply chain, and Rhino operates the part of it closest to the meter. Rhino designs and manufactures the hardware, holds the certified connections to grid operators and metering companies, and runs the platform the readings land in. ESG platforms, tenant apps, property management systems, and energy consultancies across Europe collect through that layer, some under their own brand.
That matters when a building does not cooperate. An unusual meter, a protocol nobody documented, a provider not yet connected: these become engineering questions with a route to an answer, rather than a limit inherited from a supplier. Rhino has run that route in more than 40 countries.
More about RhinoOwn
hardware, designed and built by Rhino, so meter coverage is a roadmap item and not a vendor limit
40+
countries with meters connected, across every commercial asset class
White label
partners and resellers run Rhino collection under their own brand, which is how the same layer reaches portfolios Rhino never meets directly
Common questions
Utility data automation, answered.
Utility data automation is the collection of meter readings without manual intervention: no site visits, no portal logins, no spreadsheet entry. A connection is made once per meter, and readings arrive on a fixed interval from that point on. In commercial real estate it covers electricity, gas, water, and heat, including submeters at tenant, floor, and circuit level. The readings are validated and standardised on arrival, so figures from different countries, providers, and meter types can be compared and totalled directly.
Monitoring describes what you do with data once you have it: charts, alarms, benchmarking. Automation describes how the data got there. The two are often sold together, which hides the fact that a portfolio can run a monitoring platform on numbers that were still typed in by hand each quarter. If the collection is manual, the dashboard inherits every gap and estimate underneath it. Automation is the part that determines whether the reporting can be trusted.
In most cases no. Rhino connects to the meters already installed, through three routes: Rhino hardware for meters with no digital output, certified provider APIs where a smart meter already reports to a grid operator or metering company, and existing BMS or submetering systems where those are in place. Most portfolios end up using a mix. Because the existing infrastructure stays, the capex needed to start is low, and a building does not have to wait for a metering project to become visible.
Yes, and it is the case where automation earns the most. Every market has its own grid operators, metering companies, data formats, and access rules, so a portfolio spread across borders is where manual collection breaks down first. Rhino holds the provider connections per market and normalises everything on arrival, so a building in Poland and a building in the Netherlands report in the same units against the same timestamps. Rhino has meters connected in more than 40 countries.
Measured data is what these frameworks ask for, and estimated data is what gets challenged. Automated collection produces a figure that traces back to a specific meter at a specific timestamp, which is the evidence an auditor or assessor wants to see. It also closes the coverage gaps that force estimation in the first place, since a building that cannot be reached shows up as an open item rather than being modelled into the total. Rhino data feeds CSRD, GRESB, EPBD, EU Taxonomy, and BREEAM reporting, either from the platform or through the API into the ESG system you already use.
Stop collecting it by hand.
Tell us how many buildings you have, which countries they sit in, and what is metered today. We map your portfolio against the three connection routes and tell you what can be automated now and what needs hardware first.
Further reading
From the Rhino blog.

