


Logistics
Logistics utilities
at scale. Visible.
From single distribution centers to portfolios of hundreds, Rhino gives logistics owners and operators per-site, per-utility consumption with the granularity that grid headroom, cold storage and CSRD now demand.
Why now
Automation, EV fleet charging and AI workloads are pushing logistics sites to their grid limits. Connection queues run 2-10 years across the EU, and GRESB's industrial data coverage still sits at 56%.
56%
GRESB 2025 average energy data coverage in industrial and logistics
40-60%
of cold-chain facility energy is refrigeration
2-10 yrs
current EU grid connection approval timelines


The problem
Three things logistics portfolios get wrong.
Power constraints, cold storage intensity, and CSRD data sharing all trace back to the same root: no per-site, per-system load visibility.
Asset Manager · Facility Manager
The power gap is the binding constraint on portfolio growth.
Automation, EV charging and cold storage are exceeding standard grid connections across logistics parks. Without per-site load visibility at 15-minute intervals, capacity planning is a guess and new build delays run 2-10 years across the EU. The operator who knows their actual headroom moves first.
ESG Lead · Facility Manager
Cold storage and automation are blowing out intensity benchmarks.
Refrigeration alone drives 40-60% of cold-chain energy use. GRESB now benchmarks against ASHRAE 100:2024 thresholds. Poorly metered sites underperform peers visibly in annual submissions, and the drift that costs margin is often invisible until the quarterly bill arrives.
ESG Lead · Asset Manager
CSRD Category 8 forces landlord-tenant data sharing that does not exist.
Upstream leased assets are now a material Scope 3 line for corporate logistics tenants. The 2025 Model Commercial Lease ships with green-lease data-sharing clauses as default. Landlords without per-tenant metered data face annual data requests that result in estimates at best.
Client

Customer story · Logistics
How GLP cut energy costs 26% across a multi-country warehouse portfolio.
GLP had no consistent view across their European warehouse portfolio. Manual meter reads and quarterly bill reviews left energy costs unmanaged and GRESB submissions running on estimates. They chose Rhino to change both.
Multi-country portfolio via utility APIs and low-CAPEX submeters. Per-site 15-minute interval data replaced manual meter reads across every warehouse.
Refrigeration and HVAC isolated at submeter level. Anomaly alarms surfaced compressor faults and overnight load spikes within hours, not on the next bill.
GRESB data coverage from partial to full in one reporting cycle. ESG submissions now run on metered actuals, not estimates or data gaps.
26%
Energy cost reduction across portfolio
15min
Interval data per site
Full
GRESB data coverage

GLP
Electricity, Gas
Customers
Logistics investors and operators across Europe.
Leading logistics real estate owners and managers rely on Rhino to monitor utility consumption across their warehouse and distribution portfolios.
How Rhino helps
Data that makes your logistics portfolio manageable.
Three problems. Three direct responses. All from the same data source.
See every site's actual load profile.
15-minute interval submeter data per site shows real load, real headroom, and real cost. Capacity, EV, solar and battery investment cases stop being guesses and start from measured actuals.
See Portfolio OperationsIsolate refrigeration, automation and HVAC.
Submeter granularity per system, with alarms on drifting compressors, door-seal failures and overnight load spikes. Multi-utility intensity in one place for GRESB and CSRD submissions.
See Portfolio OperationsTenant data sharing as a default, not a chase.
Cloud-to-cloud utility provider API ingestion captures landlord-side data with zero on-site hardware where possible. Automated tenant allocation produces audit-ready exports for Scope 3 Category 8 without an annual data request cycle.
See ESG & Compliance
Who uses it
Different roles. Same data.
The asset manager needs capacity headroom evidence. The ESG lead needs GRESB-aligned coverage. The FM needs refrigeration alarms. Rhino delivers all three from one data feed.
Asset Manager
Portfolio-wide load visibility and a capacity headroom story.
Portfolio-wide visibility of capacity headroom, leasing-ready power security stories, and an evidence base for EV, solar and battery business cases. Every site's actual load versus nameplate, continuously.
ESG Lead
GRESB-aligned data coverage on every asset, CSRD-ready Scope 3 exports.
GRESB-aligned data coverage on every asset, CSRD-ready Scope 3 Category 8 exports tenants can drop into their own reporting. The data sharing becomes a default, not an annual coordination exercise.
Facility Manager
Refrigeration and automation isolated, anomaly alarms in hours.
Refrigeration and automation isolated on dashboards, anomaly alarms that catch compressor or door-seal failures within hours of onset. Maintenance moves from reactive to measured before the cost lands.
Inside the platform
One platform. All utilities. Every meter.
Electricity, gas, water, heat. Submeter to portfolio. Every meter visible on one dashboard, with alarms, billing exports, and ESG-grade reports built in. The logistics portfolio view shows per-site load profiles at 15-minute intervals, so capacity planning and GRESB submissions come from the same measured dataset.
Tour the platform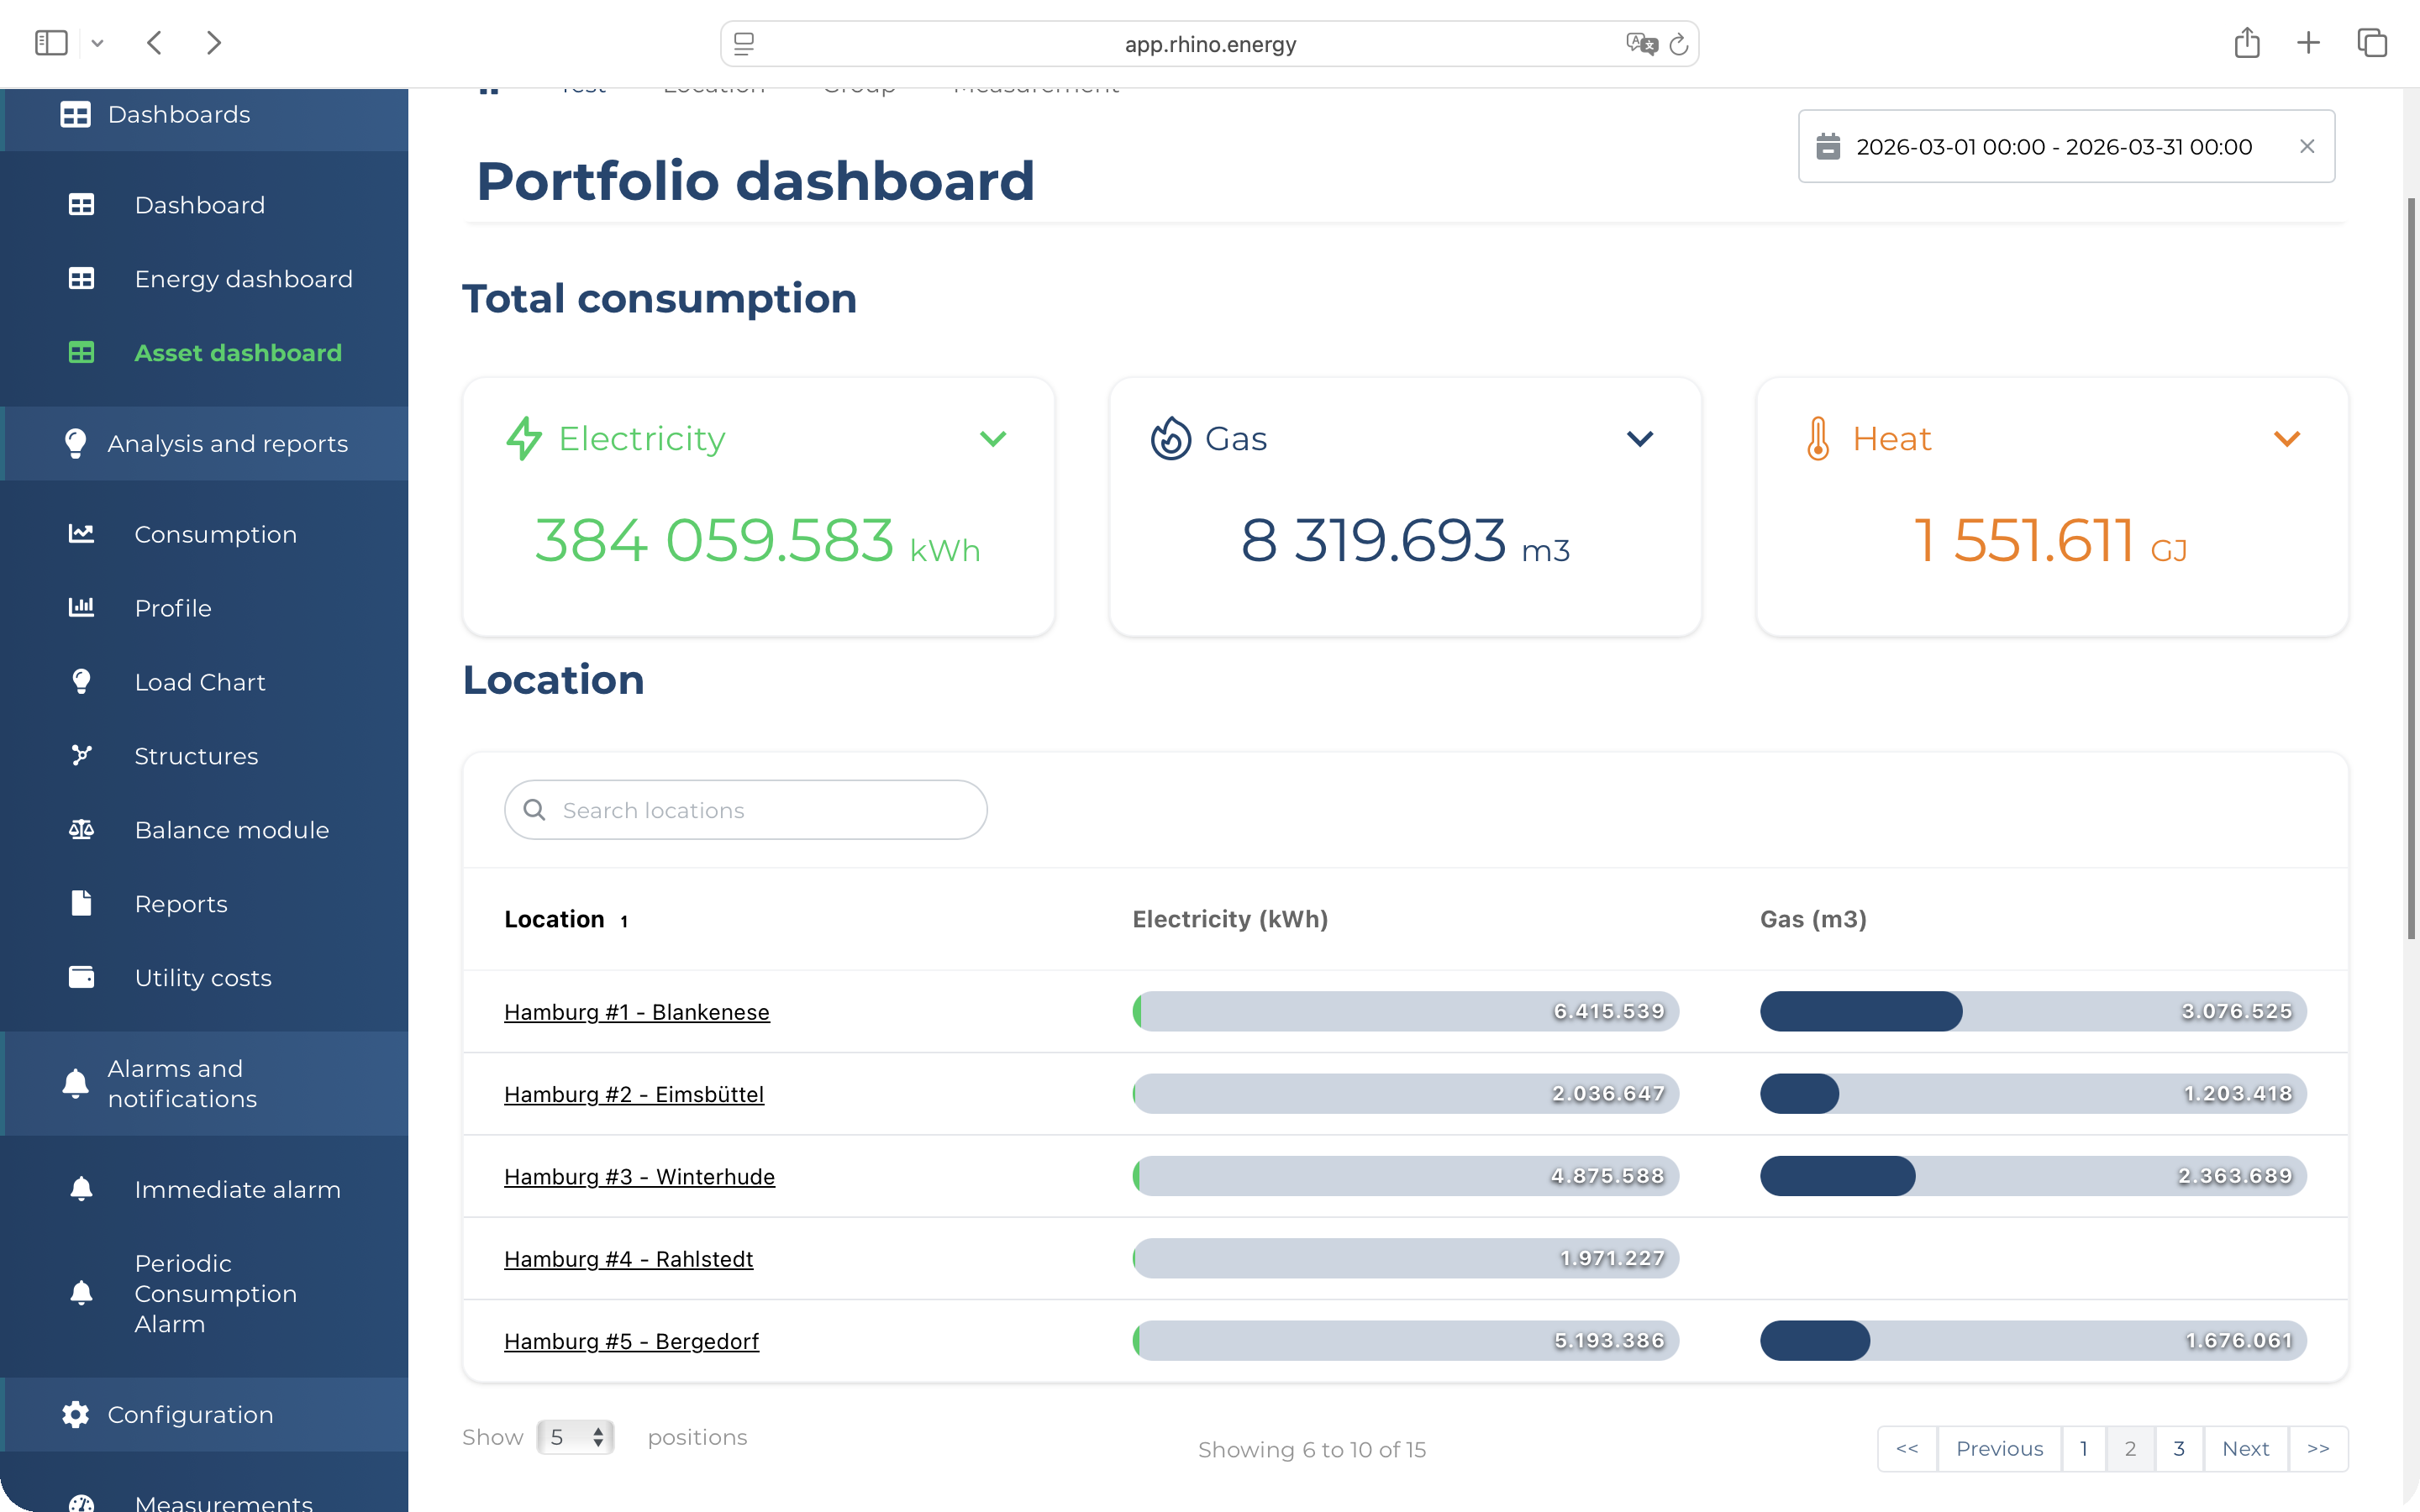
Common questions
Logistics utility monitoring, answered.
Rhino ingests data from every site through utility APIs and submeters. One dashboard shows consumption per site, per utility, per system, with portfolio-level rollups for asset managers and ESG teams. Multi-site is the default view, not an add-on.
Yes. Multi-site portfolios are the default view. Filter by region, asset class, tenant, or anything else you tag in the structure. Adding a new site is a configuration step, not a project.
Yes. 15-minute interval data shows actual versus nameplate load on every grid connection. Capacity planning starts from real numbers, not from estimates based on installed breaker ratings.
Per-tenant allocation drops into an export the tenant can place straight into their Category 8 line. The data sharing becomes a default, not an annual ask that results in a spreadsheet estimate.
Yes. Submeter granularity isolates refrigeration, automation lines, HVAC and dock loads on the same site, with anomaly alarms on each. A drifting compressor or door-seal failure shows up in hours, not on the next bill.
Bring your logistics portfolio into focus
Your buildings. Your data. Visible.
See what your portfolio looks like with all utility data in one place. We will walk you through your buildings, your meters, and what reporting looks like the day you go live.
Further reading
From the Rhino blog.

