
Heat monitoring
Find where your heat budget is going.
Rhino connects to every heat meter in your portfolio: district heating supply points, boiler circuits, and tenant interfaces. Thermal energy tracked at 15-minute intervals. Tenant cost allocation, anomaly detection, and CSRD reporting in one dashboard.
15 min
Real-time data granularity
Per circuit
Heat consumption at circuit level, not just building total
−30%
Average energy cost savings
40+ countries
Active worldwide
What you see
Every heat meter. Every circuit. Every anomaly.
Not just total thermal energy delivered. Rhino captures 15-minute intervals, rolling baselines, and overnight flow data. The detail your operations and ESG teams can actually work with.
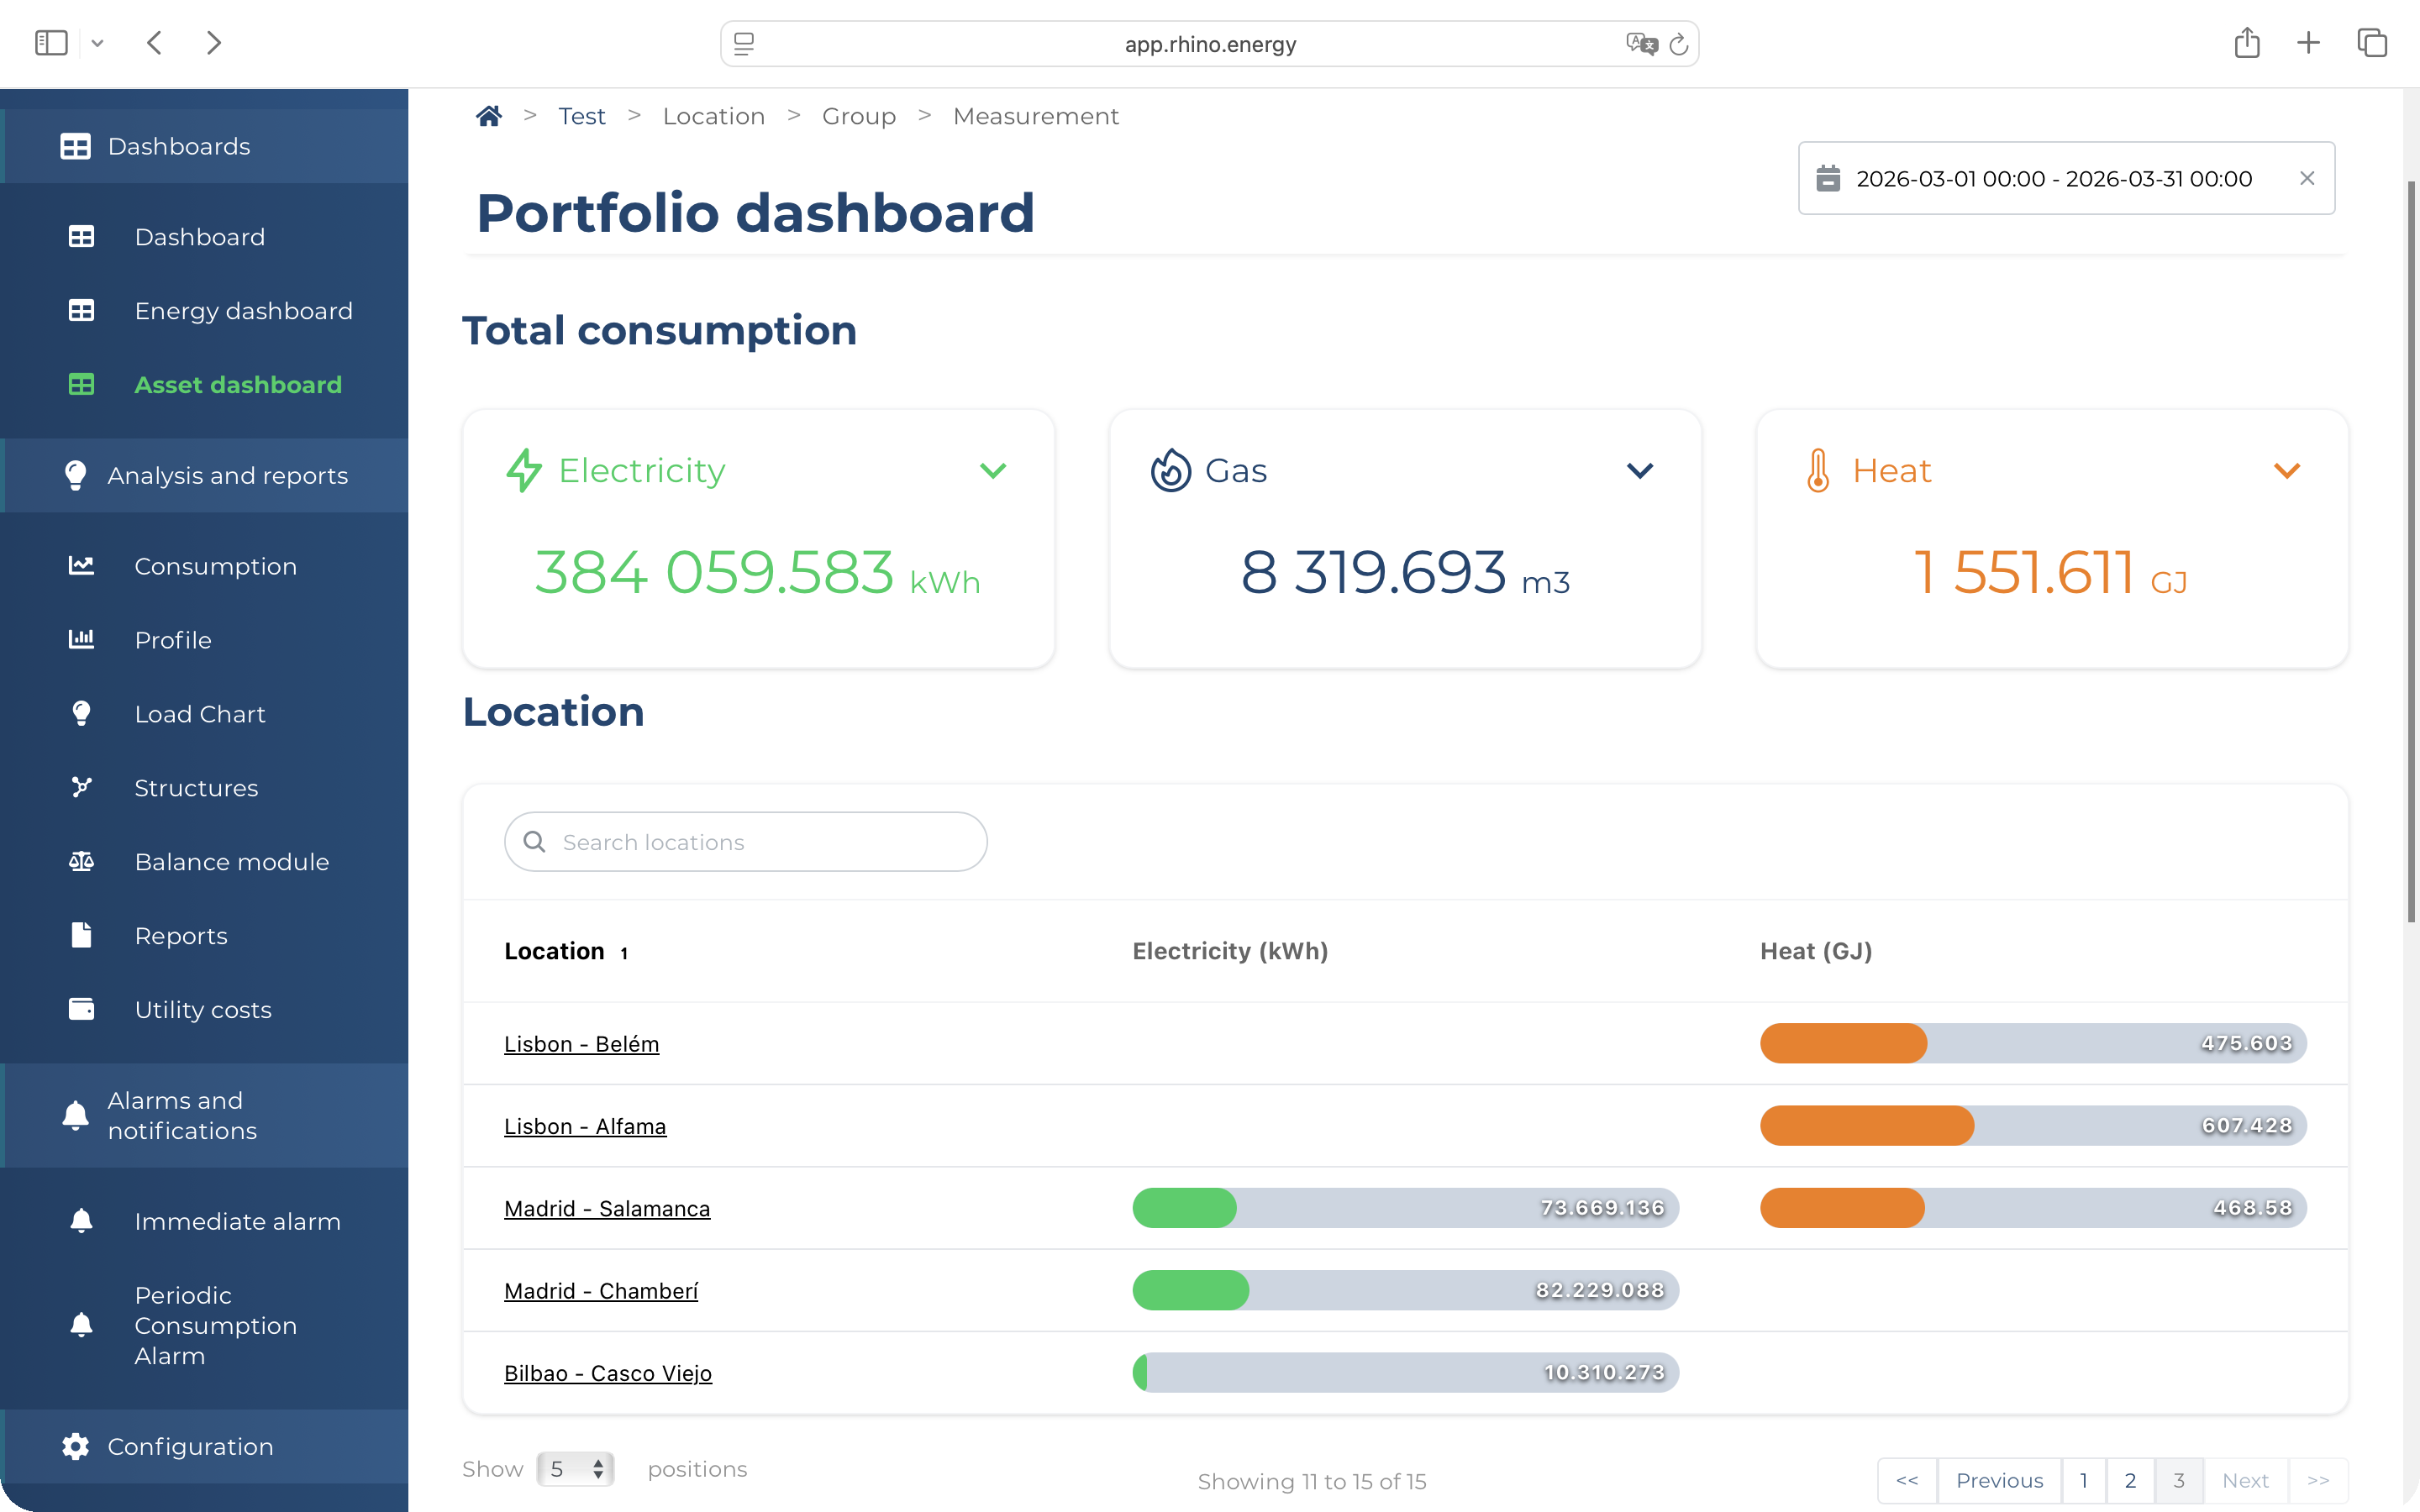
Consumption
What each heat meter used and when.
Every meter shows kWh consumption at 15-minute intervals against a rolling baseline. Compare circuit to circuit and season to season. Spot which feeds are overconsuming and which spike outside business hours.
Explore the dashboardAnomaly detection
Heat flowing when the building is empty.
Zone circuits that never drop below threshold, systems that don't respond to outdoor temperature: these are faults. Rhino tracks minimum consumption per meter and flags what's outside the expected pattern continuously.
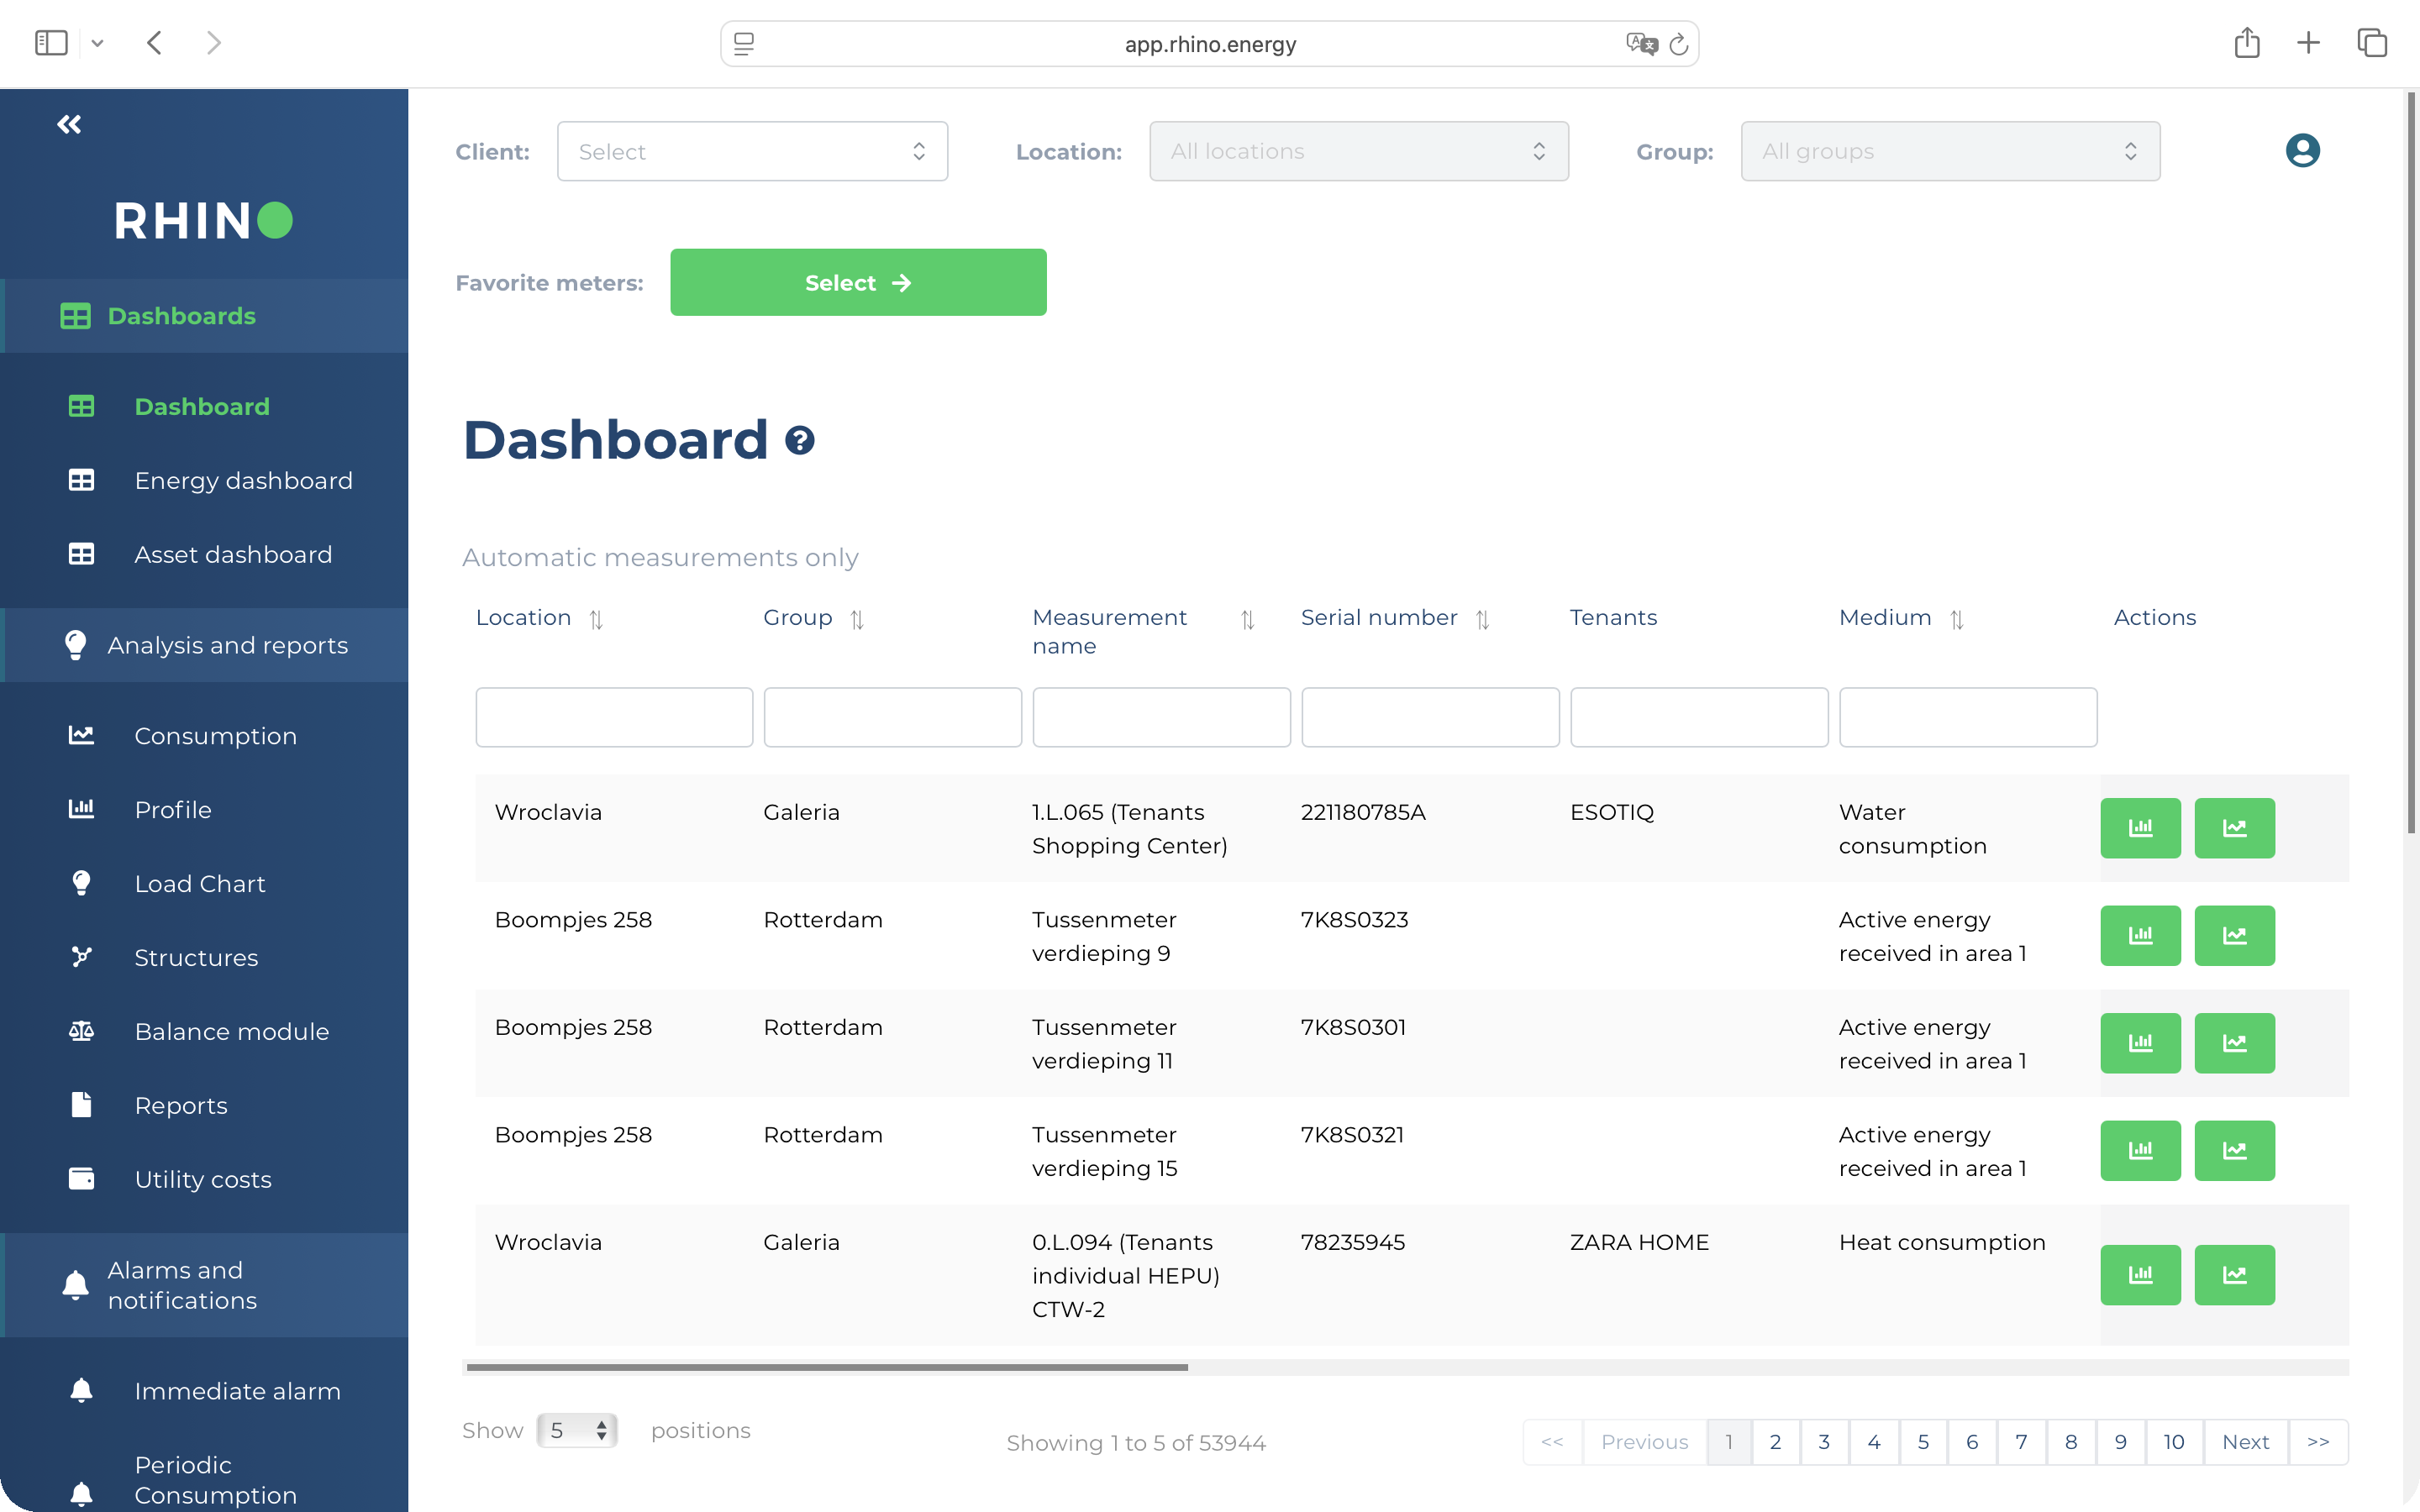
See how detection worksMeter hierarchy
Supply point to tenant meter: one view.
Map energy from the supply point through heating zones, tenant interfaces, and common areas. Each level has its own consumption history and alarm logic. The gap between supply and sub-meters is where the losses are.
See structure visualizationAlarms
An alert when heat consumption spikes.
Set a threshold per meter or time window. When it's crossed, Rhino sends the meter name, building, value, and timestamp. Catch a stuck valve or zone overrun before it shows up on the invoice.
See how alarms workUtility Connectors
Cloud-to-cloud reads from smart meter networks and utility providers across Europe and North America. No hardware on site.
Rhino Hardware
Small, non-intrusive devices for meters that software can't reach. No rewiring, no downtime, low CAPEX. EU and US certified.
Third Party Infrastructure
Connect via an existing BMS, IoT gateway, or Modbus setup. Adds Rhino to what's already installed. No CAPEX, no replacement required.
What it gives you
Stop estimating heat. Start measuring it.
Three things facility and energy managers do with Rhino heat data from day one.
Tenant billing
Bill heat by actual use, not floor area.
Floor-area allocations create disputes and systematic overpayment. Rhino gives you the exact kWh each tenant consumed per billing period, timestamped and exportable. Defensible if a tenant challenges the figure.
See how submetering worksESG reporting
The heat data CSRD requires per building.
District heat is Scope 2 under CSRD and ESRS E1. Heat from a building-owned boiler is Scope 1. Either way, Rhino captures per-asset consumption at meter level, aggregated to portfolio, audit-ready.
See ESG reportingWaste reduction
Stop heating buildings when nobody is there.
Most heat waste in commercial real estate happens outside occupied hours. Rhino's overnight minimum data shows exactly which buildings and circuits run when they shouldn't. The fix is usually a schedule correction, not a capital project.
Explore the platform
Proof
Real heat. Real portfolios.
Residential
449
apartments with automatic heat monitoring across Amsterdam
Bouwinvest · Amsterdam · Electricity, gas, water, and heat tracked per unit. Heat consumption data feeds directly into the portfolio dashboard and CSRD reporting workflow. Tenant heat cost allocation automated from day one.
Read the case study
Commercial Real Estate
Heat. Measured.
across a mixed commercial portfolio. Every meter, one dashboard.
Multiple asset types · District heating supply points, zone circuits, and tenant heat interfaces all connected · Tenant cost allocation and CSRD Scope 2 reporting active from go-live
Talk to our team
Common questions
Heat monitoring, answered.
Rhino connects to heat meters via wireless M-Bus, wired M-Bus, Modbus RTU, and pulse-output interfaces. This covers the majority of BTU and calorimeter meters installed in commercial buildings across Western Europe, including district heating interfaces and in-building heat interface units. For meters without a compatible output, Rhino's hardware team can advise on retrofit options that keep CAPEX low.
Yes. Rhino's meter hierarchy supports any depth of submeter tree: the district heating entry point or main boiler output, individual zone circuits, tenant heat interface units, and common-area systems all sit as separate nodes. Each node has its own consumption history, alarm thresholds, and reporting logic. You can compare zone performance directly and identify which circuits are overconsuming relative to expected output.
For district heating, Rhino connects to the BTU meter at the building's heat exchange point and records thermal energy consumed (kWh or GJ) at 15-minute intervals. This gives you a continuous, timestamped record of what the network actually delivered to each building, rather than relying on supplier invoices which are often quarterly and estimated. You can compare supplier billing against Rhino's independent meter readings and flag discrepancies before payment.
Under CSRD and ESRS E1, real estate companies must disclose energy consumption and associated greenhouse gas emissions per asset. Purchased district heat counts as Scope 2 energy. Heat generated on-site by building-owned boiler systems feeds into Scope 1 calculations. Rhino captures per-building thermal consumption at meter level and aggregates it to portfolio level, providing the per-asset intensity figures your ESRS E1 disclosure requires. Data is timestamped and audit-ready.
Yes. If tenant heat submeters or heat interface units are connected, Rhino records each tenant's actual kWh consumption per billing period. The data is exportable per meter per period, timestamped, and defensible if a tenant disputes the figure. This replaces floor-area allocations, which create systematic billing errors in buildings where tenants have different heating patterns or occupancy hours.
Further reading
From the Rhino blog.


Heat costs you understand are costs you can control.
Connect your buildings to Rhino and see every heat meter: thermal consumption, tenant breakdowns, and anomalies in one dashboard. Most teams find their first insight within the first week.