To measure energy savings after a retrofit, compare what the building used after the work with what it would have used without it, under the same weather and occupancy. That second number never appears on a meter. You calculate it from a baseline, and the quality of the baseline decides whether the saving holds up.
Comparing this year's bill with last year's skips that step, which is why it so often flatters a project or condemns one unfairly. This post covers how savings verification works, how degree days take the weather out of the comparison, how much baseline data you need and at what interval, and where whole-building data stops being enough.
What is energy savings verification?
Energy savings verification is the process of proving how much energy a specific measure saved, by comparing measured consumption after the measure with an adjusted baseline of what consumption would have been without it. The International Performance Measurement and Verification Protocol (IPMVP), published by the Efficiency Valuation Organization (EVO), is the most widely used framework for it.
The reason it needs a framework is that a saving cannot be metered directly. As EVO puts it, savings represent the absence of energy use, so they are determined by comparing before and after and adjusting for changed conditions. The adjustment is the whole job.
Why this year's bill against last year's does not prove a saving
A year-on-year bill comparison mixes the effect of the measure with everything else that changed. A mild winter, a new tenant on the third floor, longer opening hours, or an empty floor all move consumption, and an annual or monthly total cannot tell you which change did what.
The error runs both ways. A heat pump installed before a warm winter looks better than it is. The same heat pump installed before a cold winter can look like it made things worse. Neither result says anything reliable about the heat pump.
For the client who paid for the work, that is the uncomfortable part. A board or an investor asking whether the money worked deserves an answer that would survive a second look, and a raw bill comparison does not.
How to measure energy savings after a retrofit, step by step
Four steps turn meter data into a saving you can defend. They follow the logic of IPMVP and of the ISO standards on the same subject, without the full protocol.
Step 1: Draw the measurement boundary
Decide what you are measuring: the whole building on its main meters, or one system on its own submeter. A boiler replacement can be measured on the gas main. A lighting upgrade in one wing of a large building cannot, because its saving is too small against the noise of everything else on that meter.
Step 2: Build the baseline from data before the measure
Take consumption from the period before the work and model it against the factors that drive it: outdoor temperature for heating and cooling, occupancy or opening hours for most other loads. The model, not the raw history, is the baseline.
Step 3: Adjust the baseline to the conditions after the measure
Feed the weather and occupancy from the reporting period into the baseline model. The result is the consumption the building would have had after the retrofit date if nothing had been done. IPMVP calls this the adjusted baseline.
Step 4: Subtract and report
The saving is the adjusted baseline minus measured consumption. Report it in the same unit the audit or business case used, in kilowatt hours or megawatt hours, so it can be checked against the original estimate.
How do degree days take the weather out of the comparison?
A degree day measures how far the outdoor temperature fell below the point where a building needs heating, summed over a period. Eurostat's definition uses 18°C: a day with a mean temperature of 12°C counts as 6 heating degree days, and a day at 16°C counts as zero, because no heating is needed. A cold month collects many degree days and a mild one collects few.
Heating consumption tracks degree days closely, which is what makes them useful. Plot daily gas use against daily degree days for the baseline year and you get a line with two parts: a fixed amount the building uses regardless of weather, and an extra amount per degree day. That line is a simple baseline model. Eurostat publishes heating and cooling degree days by region across Europe, and cooling degree days do the same job for cooling loads in summer.
Worked example: a gas-heated office after a heating upgrade
Take a hypothetical office whose baseline year produces this model: 20 cubic meters (m³) of gas a day as a fixed load, plus 4 m³ per heating degree day. The heating system is upgraded, and the first 30-day winter month afterwards is compared with the same month a year earlier.
Last year that month had 400 degree days, and the building used 2,200 m³. This year the month was milder, with 300 degree days, and the building used 1,500 m³. The adjusted baseline for this year is 30 days × 20 m³ plus 300 × 4 m³, which comes to 1,800 m³.
| Which comparison is being made? | How is the saving calculated? | What does the result tell the client? |
|---|---|---|
| The bill comparison sets this year's month against last year's month. | It subtracts 1,500 m³ from 2,200 m³ and reports a saving of 700 m³, or about 32%. | It overstates the saving by more than double, because it credits the mild weather to the heating upgrade. |
| The weather-adjusted comparison sets this year's month against the adjusted baseline. | It subtracts 1,500 m³ from the adjusted baseline of 1,800 m³ and reports a saving of 300 m³, or about 17%. | It isolates the effect of the upgrade, because both figures now describe the same weather. |
| The bill comparison is repeated in a colder month with 500 degree days, when the building used 2,300 m³. | It sets 2,300 m³ against last year's 2,200 m³ and reports an increase of 100 m³. | It makes a working upgrade look like a failure, while the adjusted baseline of 2,600 m³ still shows a saving of 300 m³. |
The upgrade saved the same 300 m³ in both months. Only the weather-adjusted comparison shows it.
How much baseline data do you need, and at what interval?
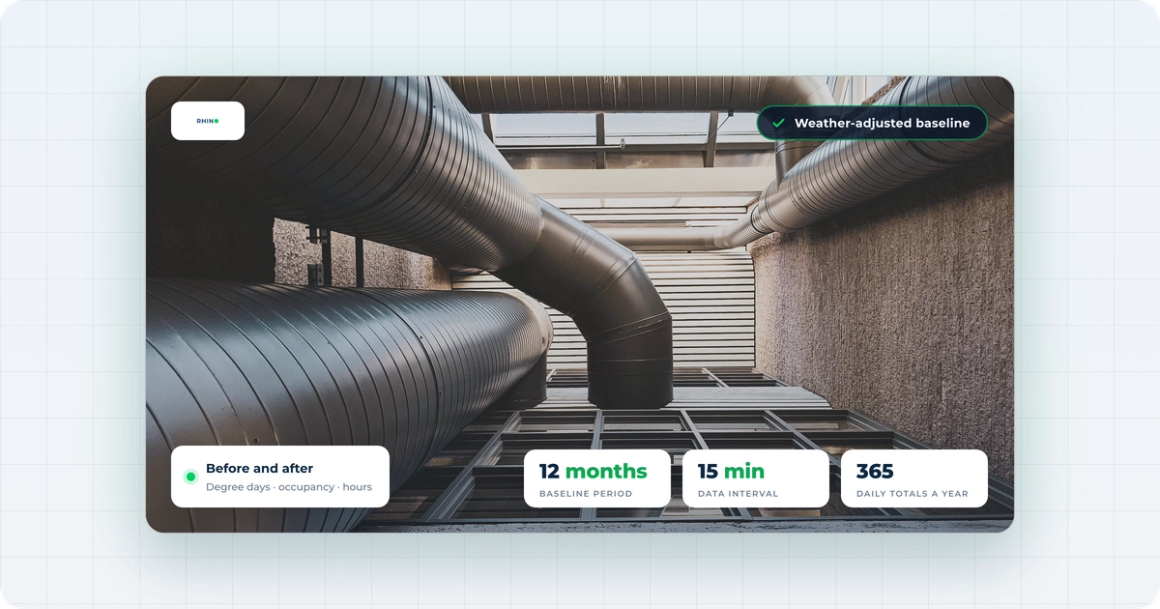
Use at least 12 months of baseline data for any building whose consumption follows the weather. IPMVP asks for a baseline that covers a full operating cycle, so every season and operating mode is represented, and for heating and cooling that cycle is a year.
The interval matters as much as the length. Monthly bills give you 12 data points a year to build a model on. Daily totals from interval data give you 365. With 12 points, one unusual month can bend the model. With 365, the model has enough data to show how the building responds to weather, weekdays and weekends.
15-minute interval data adds what daily totals cannot: when the energy is used. That lets you separate occupied hours from the night and weekend baseload, which is often where a controls retrofit does its work. It also means you see within weeks whether consumption has shifted, instead of waiting a year for the annual bill.
Rigor has a published yardstick. ASHRAE Guideline 14 covers measuring energy, demand and water savings from billing or interval data, and sets statistical tests a baseline model has to pass before its savings figure is trusted. Your auditor or M&V specialist will know which of them applies to the engagement.
Which method fits which measure?
IPMVP offers four options, and the choice depends on how large the saving is compared with the building's total use and on which meters you have.
| Which IPMVP option is it? | What does it measure? | When does it fit? |
|---|---|---|
| Option A is retrofit isolation with key parameter measurement. | It measures the most important parameter of one system, such as lighting power, and estimates the rest. | It fits simple measures where the estimated parameters are well known, such as a lighting upgrade with fixed operating hours. |
| Option B is retrofit isolation with all parameter measurement. | It measures all the energy used by the system that was changed, usually on a dedicated submeter. | It fits measures that are small compared with the whole building, such as a new chiller or air handling unit with its own meter. |
| Option C is the whole facility approach. | It measures the whole building on its main utility meters, before and after. | It fits large measures or packages of measures whose combined saving stands out clearly against total use. |
| Option D is calibrated simulation. | It uses a building energy model calibrated against measured data. | It fits cases where no usable baseline data exists, such as a building that was empty or metered badly before the retrofit. |
Two ISO standards cover the same ground for organizations. ISO 50015 sets general principles for measuring and verifying energy performance, and ISO 50047 describes how to determine energy savings, including establishing a baseline and normalizing consumption.
Why savings verification matters more from October 2026
Retrofit money is being spent now, and the rules attached to it increasingly ask for evidence of the result. The recast Energy Performance of Buildings Directive (EPBD) requires member states to set minimum energy performance standards so that non-residential buildings move out of the worst-performing 16% of the stock by 2030 and the worst-performing 26% by 2033. The measures that achieve that are being paid for this year and next.
The Energy Efficiency Directive (EED) adds a second test. Under Article 11 of Directive (EU) 2023/1791, enterprises above 10 terajoules (TJ) of average annual energy use must complete an energy audit by 11 October 2026, then draw up an action plan based on its recommendations and publish information on its implementation. Audits repeat at least every four years, so the next audit is where the planned savings meet the measured ones.
That is why our post on the EED energy audit and what a compliant action plan has to contain recommends stating each saving in megawatt hours per year. A saving in megawatt hours can be checked against meter data. A saving that was never measured against a baseline cannot.
Where whole-building data falls short
Main meter data cannot verify a measure whose saving is small compared with the building's total consumption. If a measure is expected to save a few percent of the main meter's use, normal variation in occupancy and operation can be larger than the saving itself. That measure needs a submeter on the system it changed, or an Option A or B approach.
Data also cannot be collected retroactively. Interval data exists from the day a meter is connected, so a baseline built on it has to start before the retrofit, ideally a full year before. If the work is already done, monthly bills from before the retrofit can still form an Option C baseline. It will be coarser, but it is better than no baseline.
Where Rhino fits
Rhino collects the meter data that a savings calculation runs on. It reads electricity, gas, water and heat, including submeters, at 15-minute granularity from day one, through software connections to the utility's smart meters where they exist and Rhino's own hardware where they do not. Because it connects to meters already in the building, a baseline can start months before a retrofit without new infrastructure.
For an energy consultant, that changes three things. The baseline and reporting periods come from the same source at the same interval, so the comparison is like for like. Load profiles show whether night and weekend consumption actually dropped after a controls change. And the Rhino Utility Data API delivers the data straight into whatever model or spreadsheet you use for the calculation.
Rhino does not build the baseline model or sign off the saving. That stays with you or the client's auditor. Rhino is the data layer underneath, so the number you sign off rests on measured consumption rather than estimated reads.
Frequently asked questions
How do you measure energy savings after a retrofit?
Compare measured consumption after the retrofit with an adjusted baseline: the consumption a model built on pre-retrofit data predicts for the same weather and occupancy. The difference is the saving. A simple comparison of this year's bill with last year's does not work, because weather and occupancy changes get counted as part of the saving.
How long should the baseline period be before an energy efficiency measure?
Use at least 12 months of baseline data for any building whose energy use follows the weather. The International Performance Measurement and Verification Protocol (IPMVP) asks for a baseline that covers a full operating cycle, and for heating and cooling that cycle is a year, so every season is represented in the model.
What are degree days and why do they matter for energy savings?
Degree days measure how much heating or cooling the weather demanded over a period. Eurostat counts a day with a mean temperature of 12°C as 6 heating degree days against an 18°C base. Modeling consumption against degree days lets you compare a mild winter with a cold one fairly, so the weather is not counted as a saving.
Is monthly billing data enough to verify energy savings?
Monthly bills can support a whole-building comparison for large measures, but they give only 12 data points a year, so one unusual month can distort the result. Daily or 15-minute interval data gives 365 or more points, shows when energy is used, and reveals within weeks whether consumption shifted after the retrofit.
Can you verify savings from one small measure on the main meter?
Usually not. When a measure saves only a few percent of what the main meter records, normal variation in occupancy and operation can be larger than the saving. Small measures need a submeter on the system that changed, which is what the retrofit isolation options in the International Performance Measurement and Verification Protocol (IPMVP) are for.
Start the baseline before the work starts
The most useful thing to do for a retrofit planned for next year is to connect the meters now. A year of interval data before the work begins is what turns the eventual savings figure from an estimate into evidence. See how Rhino supports energy cost reduction with measured consumption data.