
US building benchmarking
ENERGY STAR Portfolio Manager, fed by your meters.
Portfolio Manager is the free benchmarking tool behind most US building laws, from NYC Local Law 84 to Boston BERDO and Austin ECAD. It needs twelve full months of data for every meter in the building. Rhino collects that data automatically, across all utilities, so nobody has to key in bills.
What it is
The tool most US benchmarking laws run on.
Portfolio Manager measures and tracks energy use, water use, waste and greenhouse gas emissions for a building or a whole portfolio. Nearly 25% of US commercial building space is already benchmarked in it.
Required by city and state laws
NYC Local Law 84, Boston BERDO, Washington DC, Seattle, Energize Denver and Washington State's Clean Buildings law all have owners benchmark in Portfolio Manager. Austin ECAD accepts it as one of two reporting routes.
A score from 1 to 100
The ENERGY STAR score ranks a building against similar buildings nationwide, adjusted for weather and use. 50 is the median. 75 or higher makes a building eligible for ENERGY STAR certification, verified by a licensed engineer or architect.
Twelve full months, every meter
Metrics need 12 consecutive calendar months of data for every active meter: electricity, natural gas, district steam, hot and chilled water, fuel oil, on-site solar, and water. A single missing month shows up as "NA" in a city's data request.
Getting data in
Three ways in. The hard part is the data itself.
Portfolio Manager accepts data three ways. Each one assumes someone already has complete, correct monthly figures for every meter. That is where most benchmarking effort goes.
Manual entry
Type each bill into each meter, month by month. Workable for one building. For a portfolio it means hundreds of entries a year, and every typo flows straight into the score.
Spreadsheet upload
Portfolio Manager generates templates to upload many meters and months at once. Faster, but the spreadsheet still has to be filled from bills, portals and meter reads first.
Web services
An API that software providers and more than 75 utilities use to exchange data. Many utilities deliver whole-building monthly totals this way, where the owner requests it.
Utility data covers the building, not the tenant. Aggregated utility data arrives as whole-building monthly totals, only from utilities that offer it. It does not show which tenant or system used the energy, and it does not cover meters behind the utility meter, such as tenant submeters. Sources: ENERGY STAR and the city and state benchmarking program pages, checked October 2026.
Rhino's role
Meter data first. The benchmark follows.
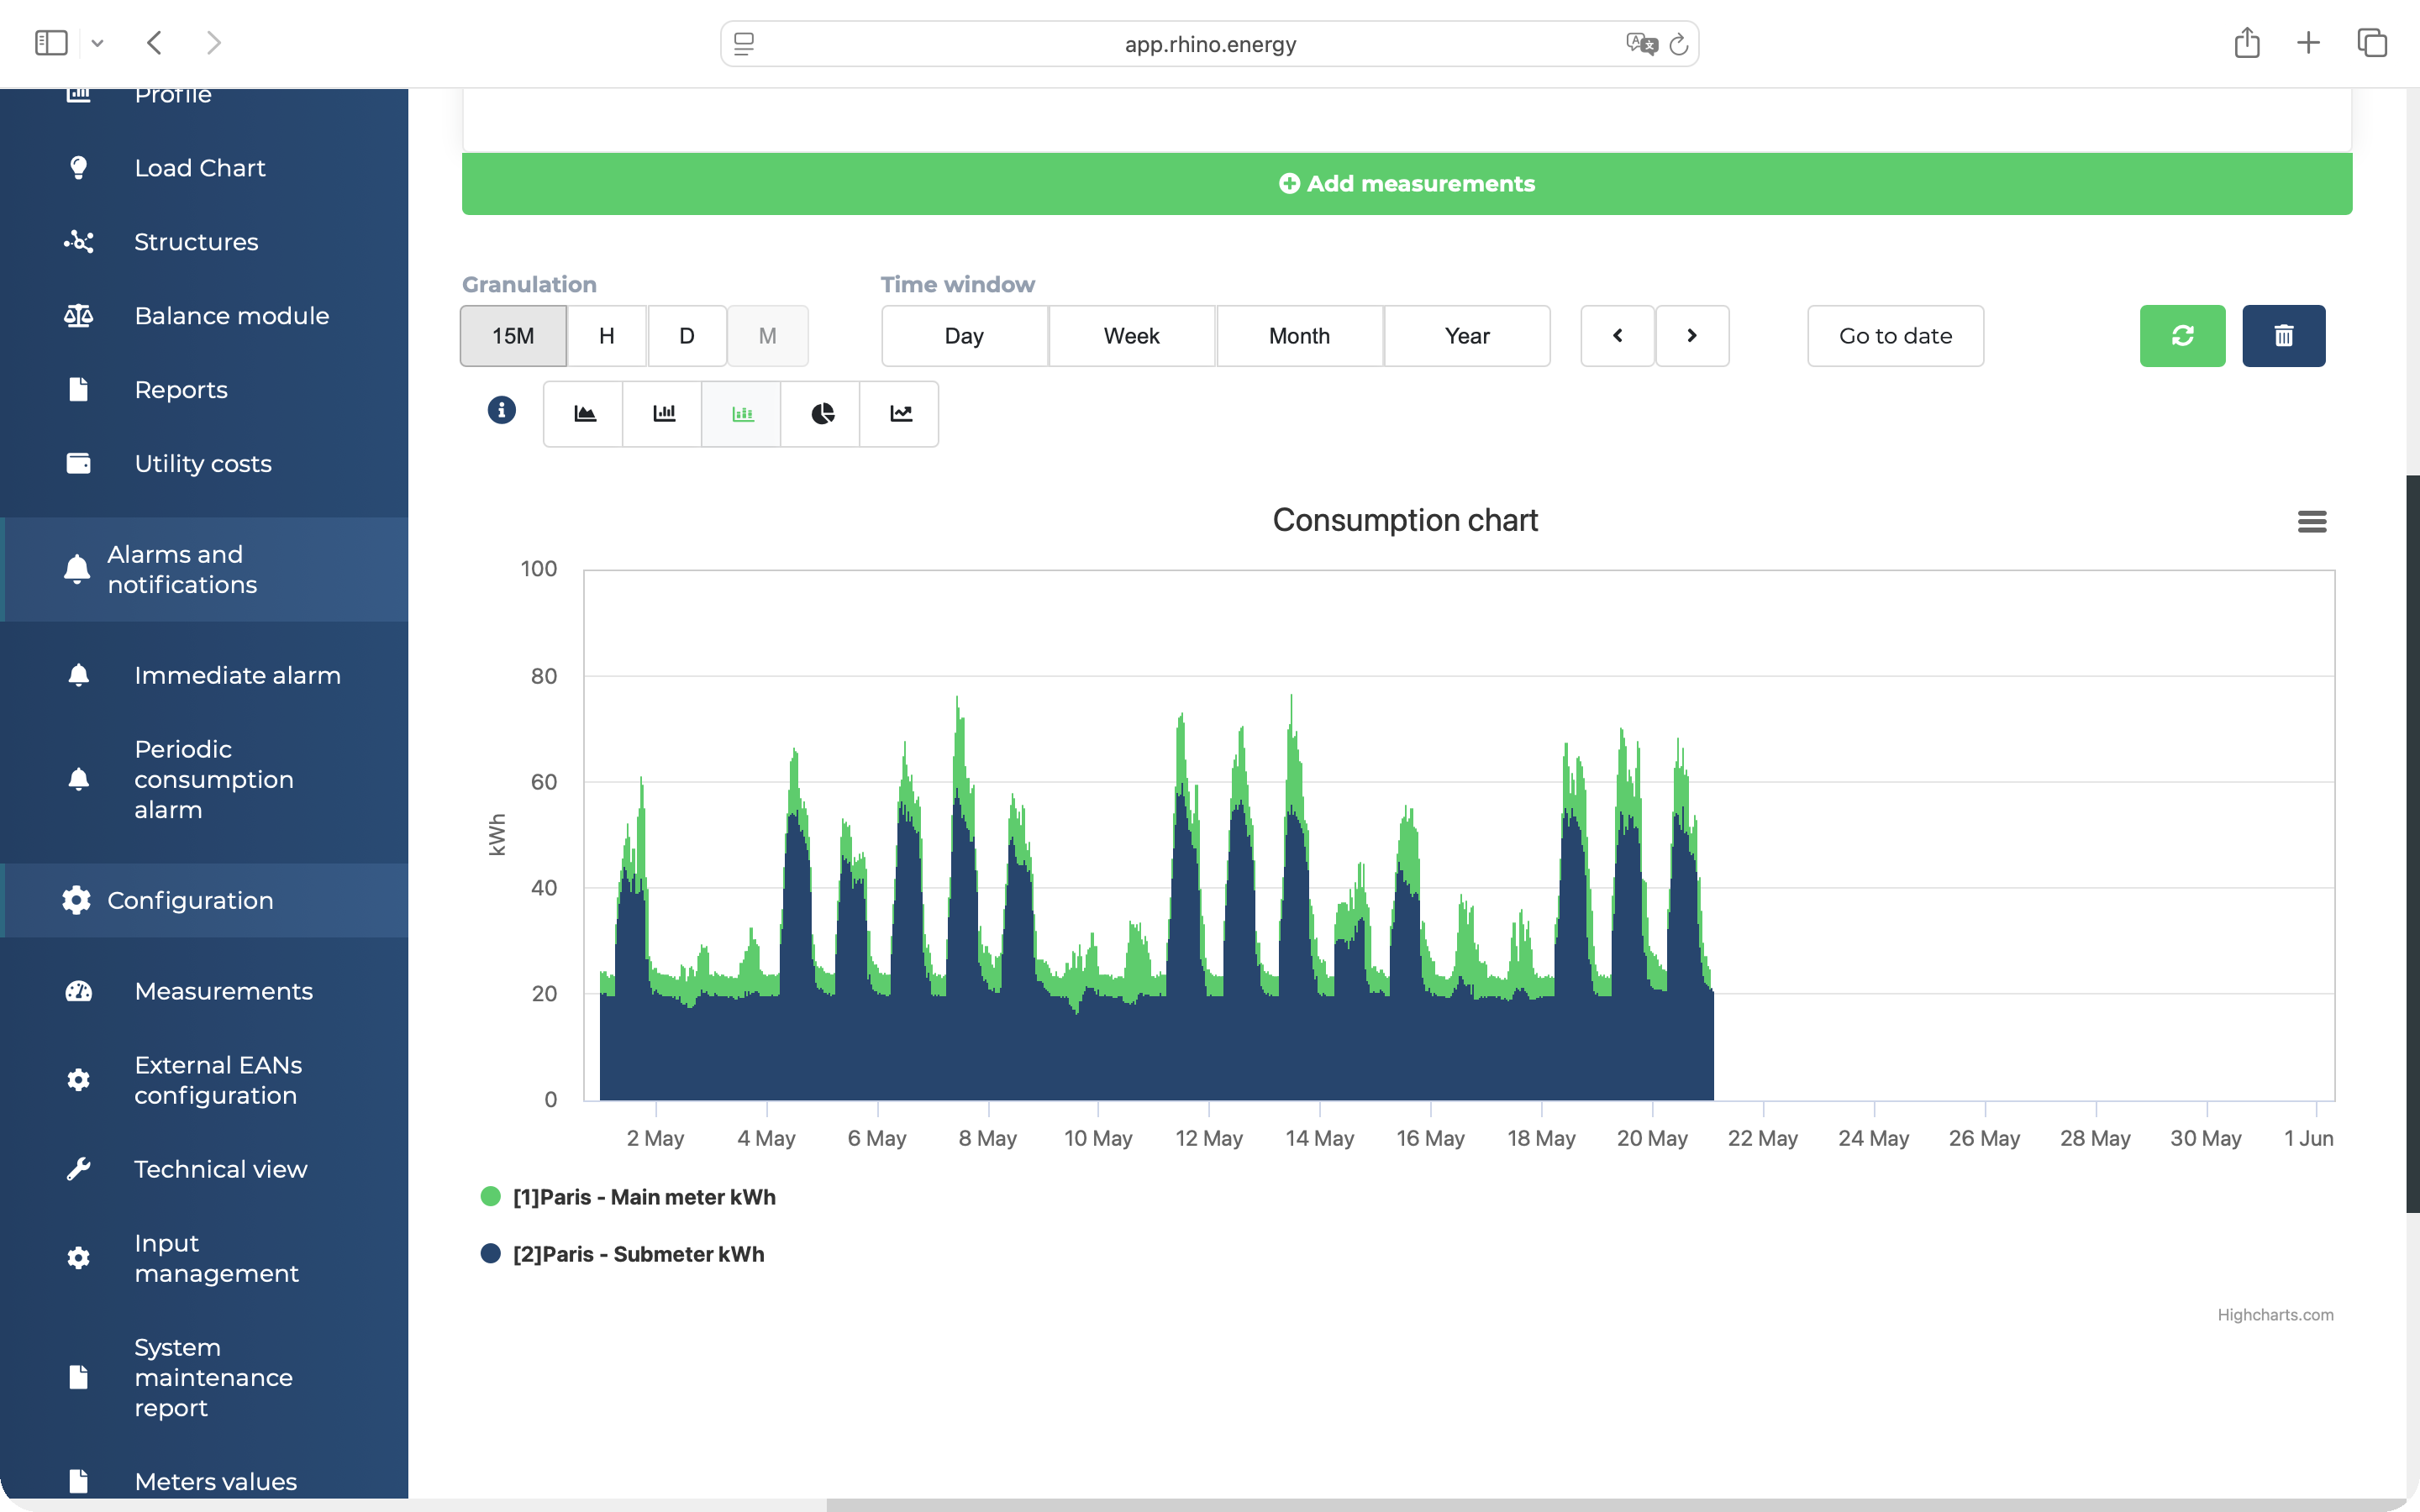
Rhino reads every meter in the building automatically and keeps the full history. Benchmarking becomes an upload of figures you already trust, instead of a yearly hunt through bills.
01
Every meter, every month, complete
Electricity, gas, water and heat, including submeters, read through existing smart meters or Rhino hardware. No missed reading, no month that has to be estimated, no gap that turns a metric into "NA".
02
Monthly totals ready to upload
Export consumption per meter by calendar month and load it into Portfolio Manager's spreadsheet templates. Consultants and ESG platforms such as Measurabl can take the same data through the Rhino Utility Data API.
03
See why the score moved
A score is one number a year. Rhino's 15-minute data shows what is behind it: the plant that runs all weekend, the tenant whose load doubled, the floor that never switches off. Fix those, and the next score shows it.
What Rhino covers
All utilities
Electricity, gas, water, heat, including submeters. Every meter Portfolio Manager asks for, in one platform.
15 min
Default data granularity, stored from day one. Monthly totals are built from measured intervals.
12 months
What every meter needs for a valid benchmark. Rhino keeps the history complete.
Common questions
Portfolio Manager, answered.
Portfolio Manager is a free online tool from the ENERGY STAR program for measuring and tracking a building's energy use, water use, waste and greenhouse gas emissions. It calculates metrics such as energy use intensity and the 1 to 100 ENERGY STAR score, and it is the reporting tool for most US benchmarking laws.
The score from 1 to 100 shows how a building's energy performance ranks against similar buildings nationwide, adjusted for weather and how the building is used. A score of 50 is the median. A score of 75 or higher means the building performs better than at least 75% of its peers and may be eligible for ENERGY STAR certification. Offices, multifamily, hotels, warehouses, retail and 24 property types in total can receive a score.
The building needs a score of 75 or higher, based on 12 consecutive months of energy data for all active meters. A licensed Professional Engineer or Registered Architect verifies the application, which must be submitted within 120 days of the end of that 12-month period. Certification is annual, so the building reapplies each year.
There are three ways: enter it manually, upload it with spreadsheet templates generated in Portfolio Manager, or exchange it through web services, an API used by software providers and many utilities. Some utilities deliver whole-building monthly data automatically on request. Meters the utility does not see, such as tenant submeters, still need another source.
Dozens of US cities and states use it for benchmarking. Examples include NYC Local Law 84 (due May 1), Boston BERDO (due May 15), Washington DC benchmarking, Seattle, Energize Denver and Washington State's Clean Buildings law. Austin ECAD accepts Portfolio Manager as one of two reporting options, due June 1. Thresholds and deadlines differ, so check each program.
Yes. Under an agreement signed in March 2026, the Department of Energy now leads the ENERGY STAR program, and the program is funded for fiscal year 2026. The published transition plan moves hosting of Portfolio Manager from the EPA to the Department of Energy before July 2027. Benchmarking laws that require Portfolio Manager still apply.
Stop keying in bills. Benchmark from measured data.
Rhino connects to the meters you already have and keeps a complete history for every one of them, across all utilities, ready for Portfolio Manager.
Further reading
From the Rhino blog.

