GRESB scores you on the data you report, and it can tell the difference between a number you measured and a number you guessed. Estimated data is allowed, but only up to a point. Go over that point and your data coverage drops, and coverage is one of the easiest ways to lose or gain marks.
Here is exactly how the estimation rule works, the 20% cap that most portfolios run into, and how to stay on the right side of it.
What is the GRESB estimation rule?
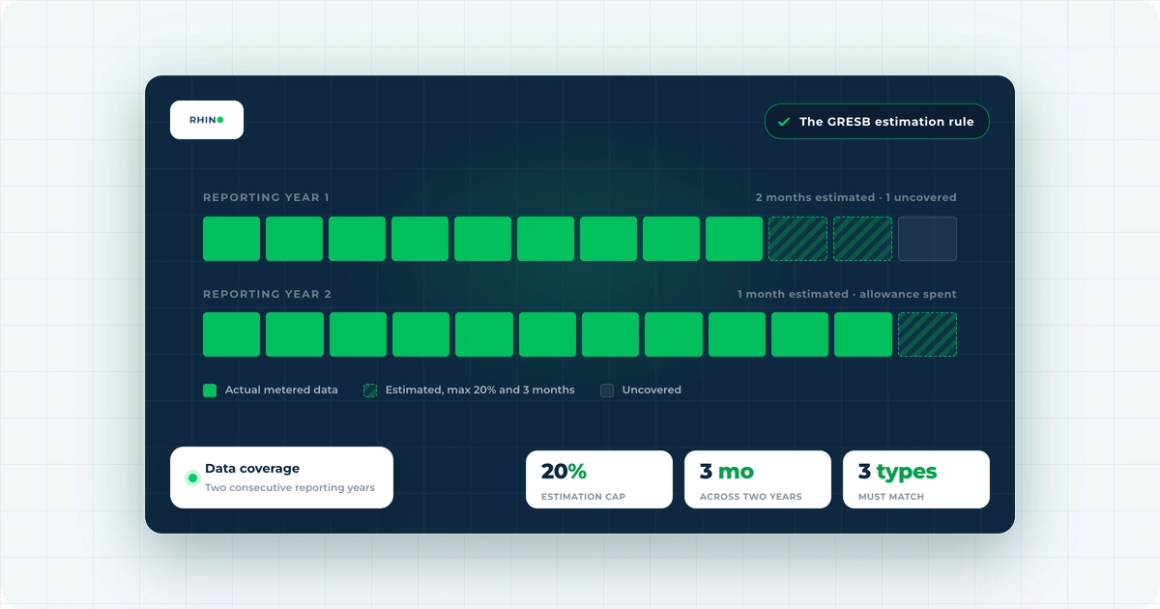
When you cannot get actual metered data for part of a reporting year, GRESB lets you fill the gap with an estimate. The rule sets a hard limit on how much of that you can do. Estimated data must not exceed 20% of the total period for which you have actual data. It is a cap on gaps, not a licence to model a full year from a few reads.
Estimation is only allowed when the data you do have covers the same performance aspect, the same area type, and the same utility. In practice that means you can only estimate electricity for a tenant space from other actual electricity data for that same tenant space, not from the base building or from a different utility.
The three categories that have to match:
Performance aspect: Energy, GHG, Water, or Waste. Area type: Base Building, Tenant Spaces, or Whole Building. Utility type: for energy that means fuels, electricity, and district heating and cooling as separate buckets.
The 20% rule, with a worked example
The cap is measured against the actual data you hold, not against the full calendar. If you have six months of actual electricity data for an asset, your estimated data for the missing months cannot exceed 20% of those six months, which is 1.2 months. The rest of the gap stays uncovered and counts against your coverage.
So more actual data does two things at once. It raises your coverage directly, and it raises the amount of estimation the rule will let you add on top.
The three-month cap across two years
GRESB asks for two consecutive reporting years, and there is a second limit sitting over the top of the 20% rule. Across both years combined, estimated data cannot exceed a three-month cap. You can decide how to spread the allowance between the two years, as long as you stay under 20% and under three months total. The three-month figure exists because tenants and utilities often report quarterly, so a single missing quarter is the gap the rule is built to absorb.
Why estimated data quietly costs you points
Data coverage is scored. Every month you estimate rather than measure is a month that does not strengthen your coverage, and once you hit the cap the remaining gap is simply uncovered. For a portfolio with a few assets on manual reads or slow tenant data, this is where points leak out without anyone noticing until the score comes back.
The 2026 Standard tightened this further, with stronger requirements around asset coverage and clearer target definitions. The direction of travel is one way: measured data is worth more every year, and estimation is a shrinking cushion.
How to stop relying on the cushion
The fix is not better estimation, it is more actual data. Automated collection closes the gaps that force you to estimate in the first place. Rhino pulls electricity, gas, water, and heat across a portfolio, including submeters and tenant spaces, at 15-minute granularity from day one. That means full-period actual data for the assets that used to sit on manual reads, and tenant consumption captured without waiting on a quarterly email.
Preliminary GRESB results land on 1 September with a correction window through the month, and the next submission cycle closes at the end of June. Both are good moments to look at which assets are eating your estimation allowance and fix the data feed before it costs you again.
See how Rhino gives you full-period actual data across the portfolio: explore portfolio operations.