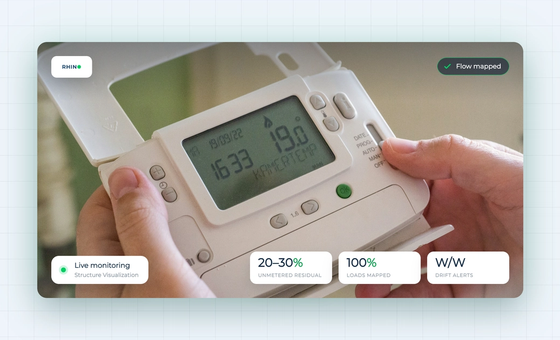
Most energy decisions in commercial real estate are still made on monthly totals: one number per meter, per month, often estimated. Interval data replaces that single number with hundreds. It is the difference between knowing you spent a certain amount and knowing exactly when, where, and why.
What is 15-minute interval data?
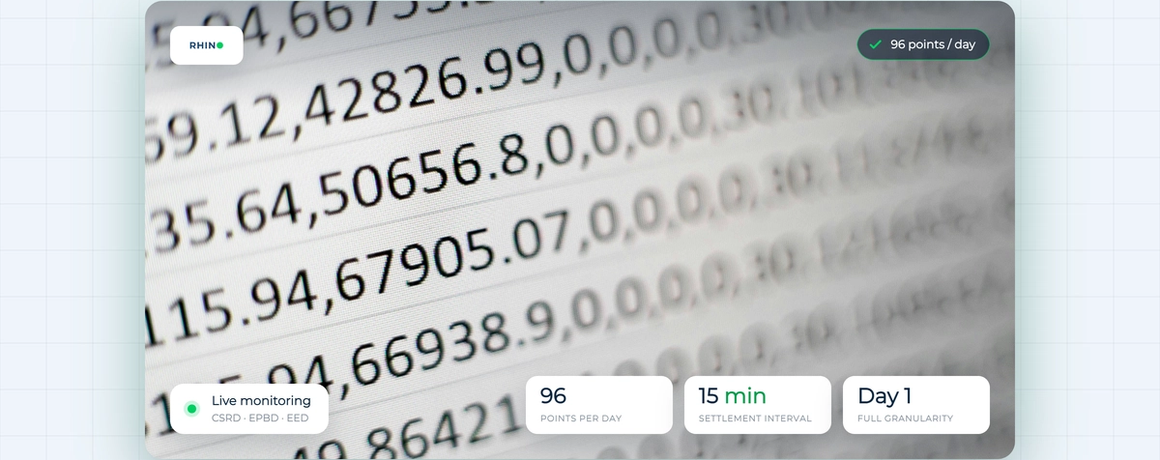
Interval data is energy consumption recorded at fixed, regular intervals rather than as a single periodic total. Fifteen-minute interval data means a reading every quarter of an hour: 96 data points per meter per day instead of one per month. Each point records what the meter drew in that window, which builds a continuous picture of how a building actually uses energy across a day, a week, and a year.
Interval data versus monthly meter reads
A monthly read tells you the total. It cannot tell you whether that total came from steady daytime use or a system running all night. Two buildings with the same monthly bill can have completely different consumption patterns, and only one of them has a problem you can fix. Monthly reads hide that. Interval data shows it.
Monthly reads are also frequently estimated, which means you are making decisions on a guess. Interval data is measured, timestamped, and specific.
What you can do with 15-minute data that you cannot with monthly reads
Spot after-hours and weekend waste
Consumption that should fall to near zero overnight but does not is one of the most common and most fixable sources of waste. You can only see it if your data has the resolution to show the overnight hours separately. A monthly total buries it.
Verify and dispute bills
Fifteen-minute data lets you check a supplier's billed consumption and peak against what the meter actually drew, at the exact time. That turns a billing dispute from opinion into a timestamped record.
Evidence for CSRD, EPBD and EED
Reporting frameworks increasingly expect measured, auditable energy data rather than estimates. The revised EPBD and the Energy Efficiency Directive both push toward remotely readable metering and more frequent consumption information. Interval data is the format that satisfies an auditor, because every figure traces back to a timestamped reading.
Allocate cost to the right tenant
Recharging tenants fairly needs consumption tied to time and space. Interval data lets you allocate what each tenant used when, rather than splitting a monthly total by floor area and hoping no one disputes it.
Why 15 minutes specifically
Fifteen minutes is the settlement interval used across most European electricity markets, so it aligns your own data with how energy is actually priced and traded. It is fine enough to reveal short spikes and after-hours loads, and standard enough that it matches supplier and grid data. Rhino stores 15-minute granularity from day one, so there is no staging period and no gap in the record while a building "warms up".
Getting interval data across a portfolio
One building with interval data is useful. A whole portfolio on the same 15-minute basis is where it changes how you run assets, because you can finally compare like with like: which building runs hot overnight, which peak is driving demand charges, which site is drifting month on month. That comparison is the point of portfolio operations, and it only works when every site reports on the same granularity from the start.