Grid congestion used to be a connection problem: you waited longer for capacity. In 2026 it is also a cost problem. As the grid fills up, the part of your energy bill tied to peak power is the part under the most pressure, and it is the part you have the most control over. You do not need new hardware to bring it down. You need to see your peaks.
What is a peak demand charge?
Most commercial energy bills have two parts. One is based on how much energy you use over time, measured in kilowatt-hours. The other is based on your highest power draw, measured in kilowatts. That second part is the peak demand or capacity charge, and it is set by your single worst moment, not your average.
In the Netherlands, any connection larger than 3x80A has to declare a contracted transport capacity, the gecontracteerd transportvermogen: the power you expect to need at any moment in the year. The grid operator bills against that figure. Set it too high and you pay for headroom you never use. Hit it with a sharp spike and you can trigger penalties or a forced step up.
Why peak charges are rising now
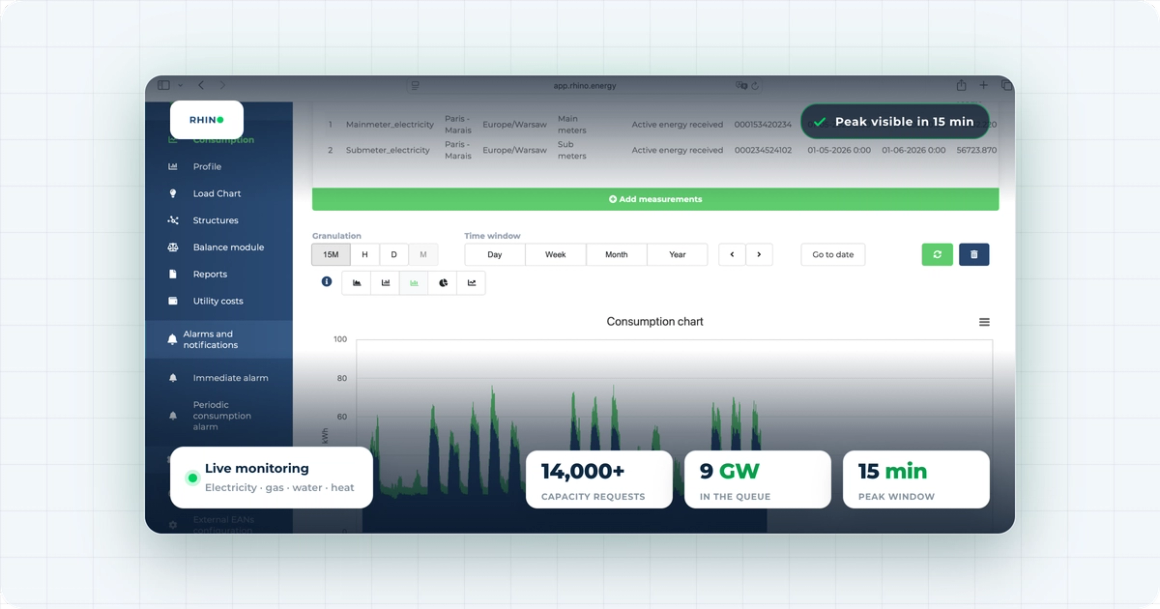
Grid congestion across the Netherlands is structural from 2026, with regional operators holding more than 14,000 requests for capacity totalling around 9 GW. In February 2026 the government set out an eight-measure campaign to shorten the connection queue. The regulator ACM has reshaped transport tariffs for the year. The details differ by operator and voltage level, but the direction is clear: the capacity component of the bill matters more, and buildings that manage their peak are the ones that stay ahead of it.
How to find your peaks
You cannot cut a peak you cannot see. A monthly meter read gives you a total, not a moment. Fifteen-minute interval data shows you the exact quarter-hour your building drew the most, and what was running when it happened.
Look for short, sharp spikes
The costliest peaks are often brief. A single 15-minute window where several large loads happen to run at once can set your capacity charge for the whole period, even if it never repeats. Interval data makes that window visible.
Separate base load from peaks
Split what runs all the time from what switches on and drives the peak. The base load is your floor. The spikes on top are what you can shift, stagger, or trim.
Four ways to cut the peak
Shift flexible loads off the peak
EV charging, water heating, and battery charging rarely need to happen at the busiest moment. Moving them to a quieter window lowers the coincident peak without changing how much energy you use.
Stagger start-up
When HVAC, lifts, and equipment all switch on together in the morning, they stack into one large draw. Sequencing that start-up over 15 or 30 minutes flattens the spike.
Right-size your contracted capacity
Once you can see your real peak across a full year, you can check whether your contracted transport capacity matches it. Many buildings carry more than they use, and pay for it every month.
Catch faults that spike demand
A failing compressor or a control fault can push demand up in a way no one notices on a monthly bill. Periodic consumption alarms flag the day-over-day and week-over-week jumps that signal something has started drawing more than it should.
Start with the data you already have
Every one of these moves depends on one thing: seeing power draw at the moment it happens, across the whole building including submeters. Rhino delivers 15-minute data from day one by connecting to your existing meters, so you can find the peak, act on it, and check that the action worked. It covers all utilities, electricity, gas, water, and heat, in one place, which is where the shiftable loads and the surprises tend to hide.
See how Rhino turns interval data into lower running costs: explore cost reduction.