
NYC building emissions law
NYC Local Law 97 and the 2030 cap.
Local Law 97 caps greenhouse gas emissions for most New York City buildings over 25,000 sq ft. Every ton over the limit costs $268, every year. The limits tighten in 2030, and the city projects that about 57% of covered properties will exceed them. Staying under starts with knowing what each building and tenant actually consumes.
What LL97 requires
An emissions limit, a yearly report, a price per ton.
LL97 sets an annual greenhouse gas limit for each covered building, based on how its floor area is used. Owners report the previous year's emissions every year, and pay for every ton above the limit.
Who is covered
A single building over 25,000 gross sq ft, or two or more buildings on one tax lot, or under one condo board, together over 50,000 gross sq ft. The Department of Buildings publishes the Covered Buildings List every year.
A report every May 1
The report covers the previous calendar year and is certified by a Registered Design Professional. Energy data is shared through ENERGY STAR Portfolio Manager and the report is filed in the city's BEAM portal. A 60-day grace period runs to June 30.
$268 for every ton over
Emissions above the limit cost $268 per metric ton of CO2e, each year. A missing report costs $0.50 per sq ft for every month it is late: $12,500 a month for a 25,000 sq ft building.
LL84, LL88 and 2030
Three laws, one set of meter data.
LL97 does not stand alone. It runs on the benchmarking data from Local Law 84 and the tenant submeters from Local Law 88, and its limits drop sharply in the second compliance period.
LL84: benchmark every year
Covered buildings report annual energy and water use in ENERGY STAR Portfolio Manager by May 1. The ENERGY STAR score sets the A to D energy grade that must be posted at each public entrance.
LL88: a submeter per tenant
Since January 1, 2025, every non-residential tenant space over 5,000 sq ft needs its own electrical submeter, and tenants get a monthly statement. Each space without one costs $500 a year.
2030: the limits tighten
In the first year, 95% of filers met their 2024 limit. The 2030 to 2034 limits are far stricter: based on 2024 data, about 57% of covered properties are projected to exceed them.
The three laws reinforce each other. An owner over the limit in 2024 to 2029 can apply for reduced penalties based on good faith efforts, but only with the LL97 report, the LL84 benchmarking report and LL88 compliance all in place. Offsets are capped at 10% of a building's limit, and renewable energy certificates can only offset emissions from grid electricity. Sources: NYC Department of Buildings and NYC Accelerator, checked October 2026.
Rhino's role
Know where the year is heading before May 1.
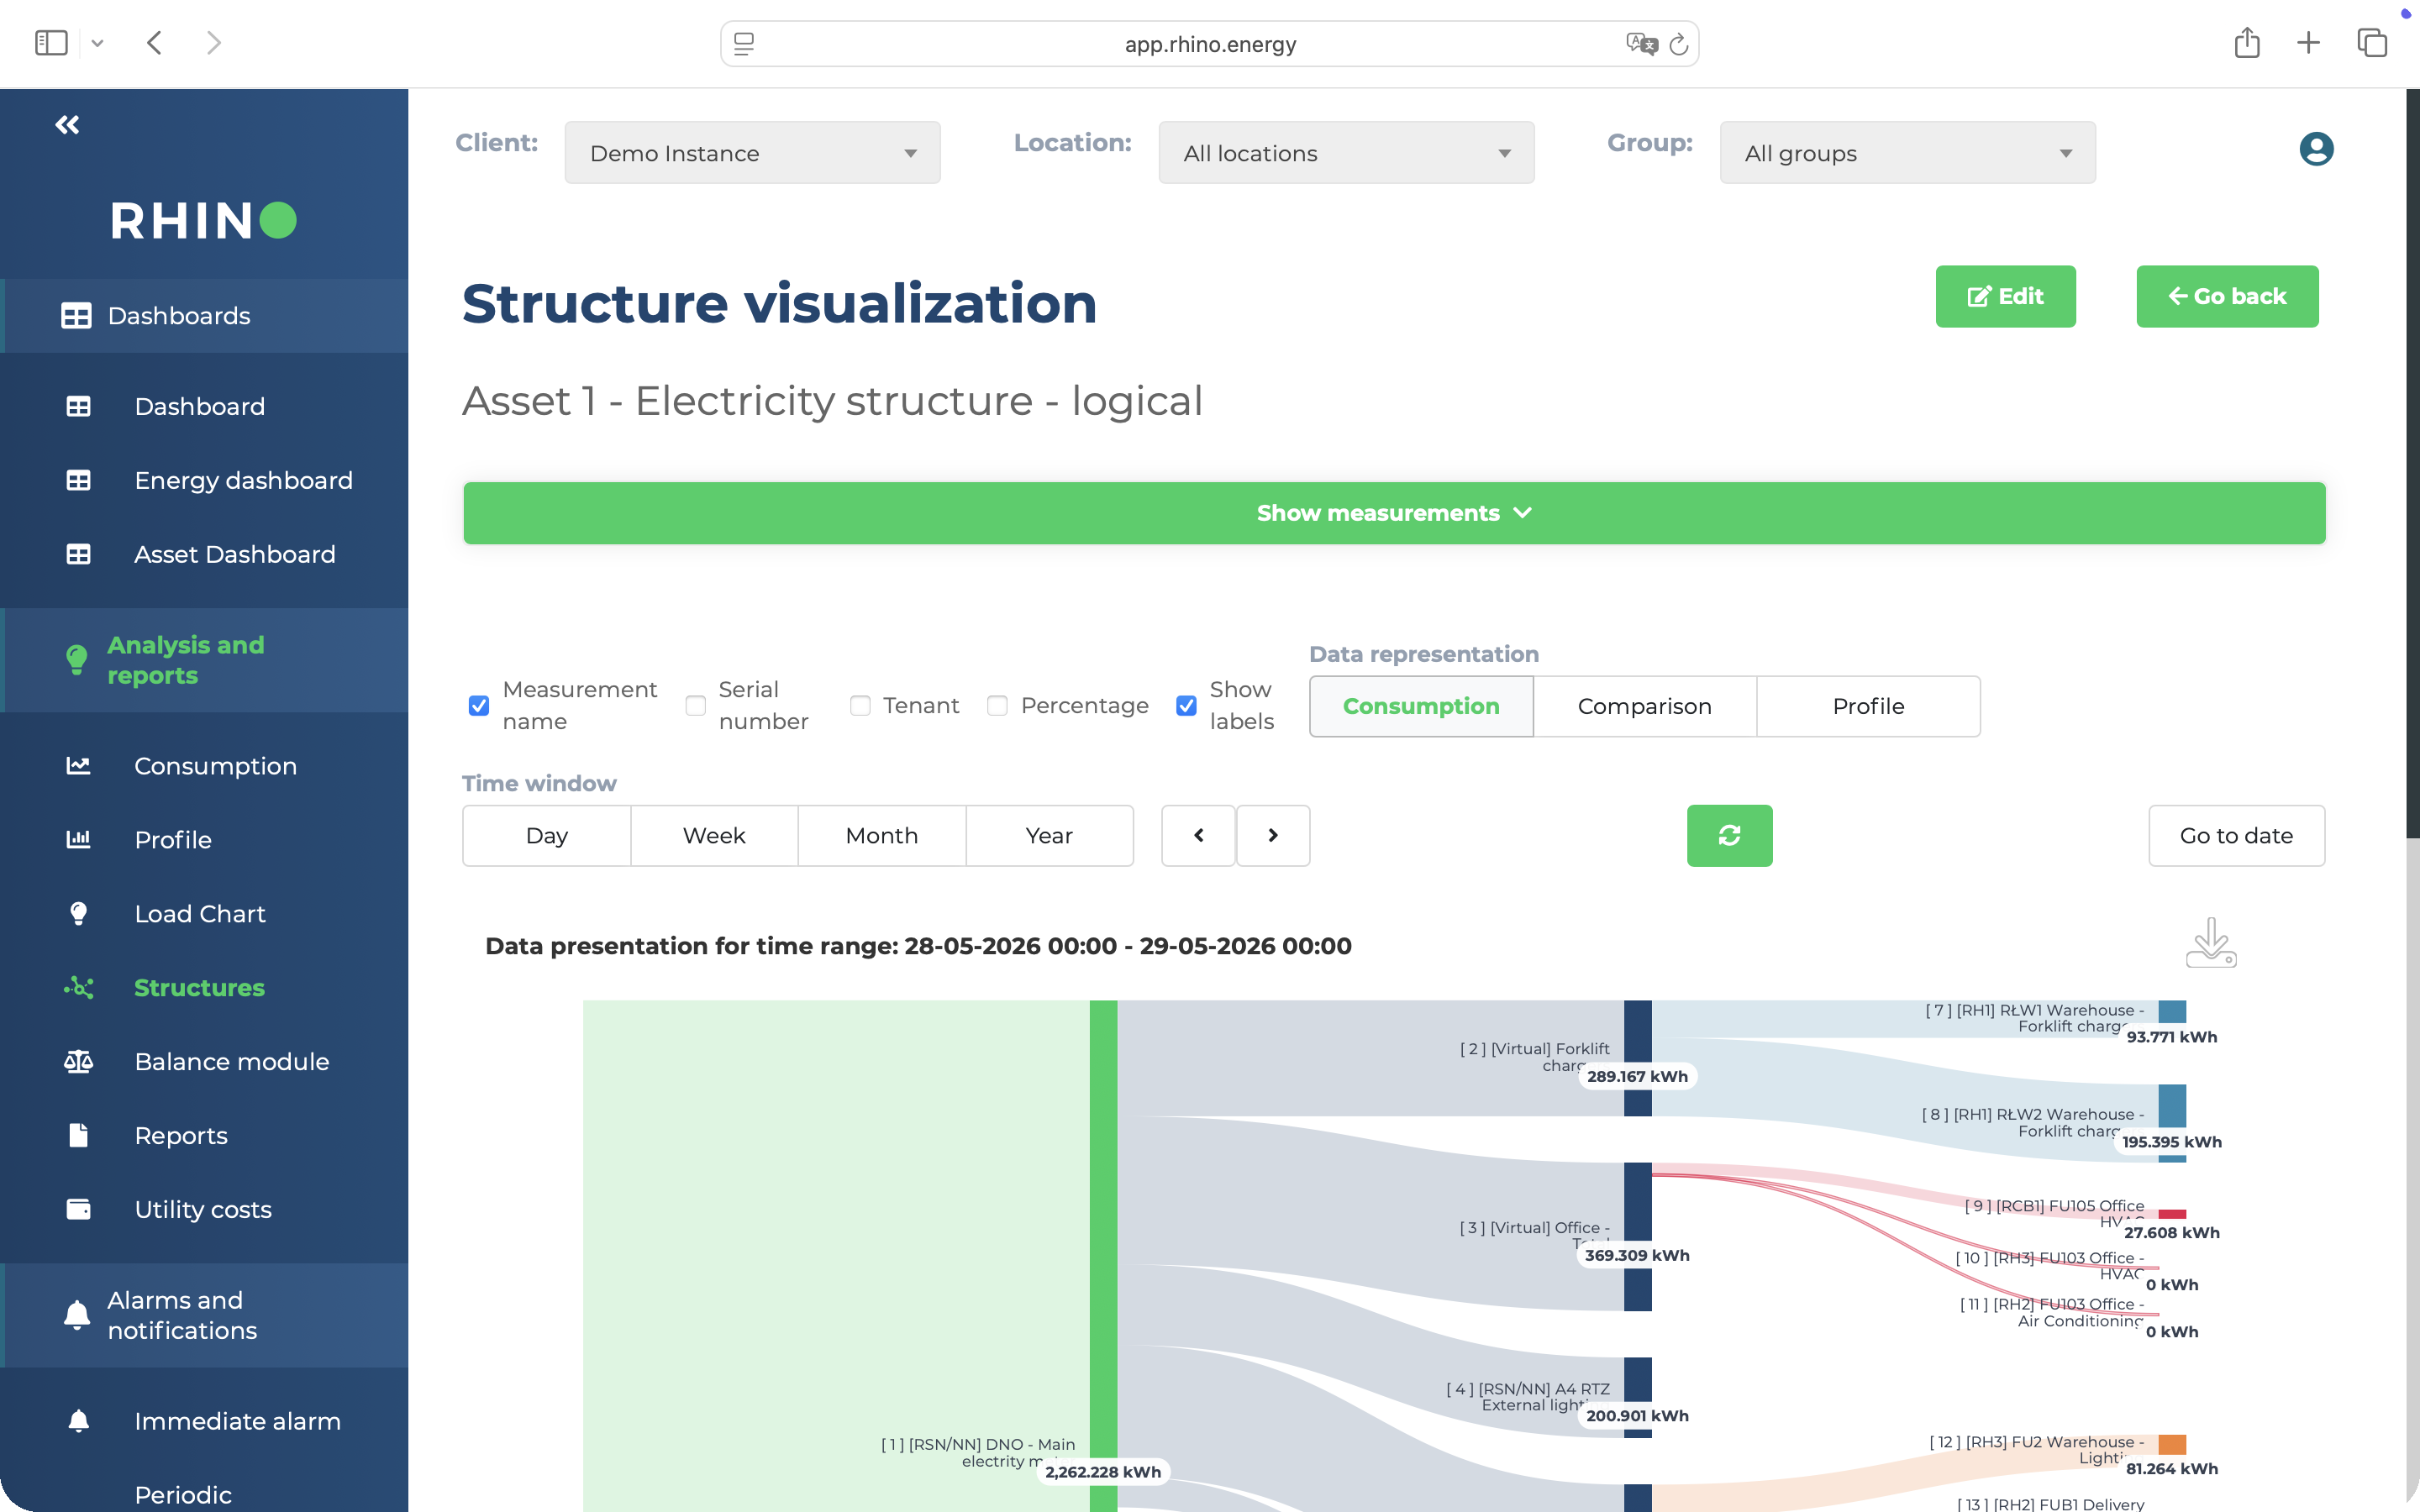
An LL97 report looks back at a year that is already over. By then, every ton is spent. Rhino collects consumption from every meter in the building, including tenant submeters, so you can see the year take shape while there is still time to act.
01
Tenant submeters that read themselves
LL88 puts a submeter in every large tenant space. Rhino reads those meters automatically, through existing smart meters or Rhino hardware, and assigns each one to its tenant. Monthly tenant statements come from measured data, not a walk-around with a clipboard.
02
Track the year, not just the report
Electricity, gas, water and heat at 15-minute resolution show after-hours waste, a plant that runs all weekend, or a tenant whose load doubled. Compare month by month against last year and see whether the building is on course for its limit.
03
Clean inputs for Portfolio Manager
LL84 and LL97 both draw on the energy data in ENERGY STAR Portfolio Manager. Rhino gives you complete monthly totals per meter to enter there, and platforms such as Measurabl receive Rhino data by API.
What Rhino covers
All utilities
Electricity, gas, water, heat, including tenant submeters. Every meter behind a building's emissions, in one platform.
15 min
Default data granularity, stored from day one. Continuous metering, not a once-a-year total.
2030
When the stricter limits start. Four reporting years to find the tons.
Common questions
Local Law 97, answered.
Local Law 97 is New York City's building emissions law. It sets an annual greenhouse gas limit for most buildings over 25,000 sq ft, requires a yearly emissions report, and charges a penalty for every ton above the limit. Its goal is a 40% cut in emissions from covered buildings by 2030 and net zero by 2050.
A single building over 25,000 gross sq ft, two or more buildings on the same tax lot that together exceed 50,000 gross sq ft, and two or more condo buildings under one board of managers that together exceed 50,000 gross sq ft. The Department of Buildings publishes a Covered Buildings List each year. Certain affordable housing and houses of worship follow a separate path under Article 321.
$268 for every metric ton of CO2e above the building's limit, every year. Failing to file the report costs $0.50 per sq ft of gross floor area for each month it is missing. In the 2024 to 2029 period, owners who show good faith efforts can apply for reduced penalties.
May 1 each year, covering the previous calendar year. There is no penalty for filing within 60 days, so by June 30, and owners can request an extension to August 29 for a fee. The report is certified by a Registered Design Professional and filed in the city's BEAM portal.
The second compliance period, 2030 to 2034, brings much stricter emissions limits. While 95% of filers met their 2024 limit, the city projects that about 57% of covered properties will exceed their 2030 limit based on 2024 data.
LL84 requires yearly energy and water benchmarking in ENERGY STAR Portfolio Manager. LL88 requires lighting upgrades and a submeter for every large non-residential tenant space. LL97 caps emissions, and its report shares energy data through Portfolio Manager. Compliance with LL84 and LL88 is also a condition for reduced LL97 penalties based on good faith efforts.
Find your buildings' 2030 gap while there is time to close it.
Rhino connects to the meters you already have, including LL88 tenant submeters, and shows what every building consumes across all utilities, every 15 minutes.
Further reading
From the Rhino blog.

