Monitor, analyze and save

The Rhino Platform supports the sustainability of your business by offering tools which will help reduce your utility consumption and CO2 emissions.

Find out more
Zużycie mediów

RHINO PLATFORM

Your application
for special operations

Optimise your utility consumption

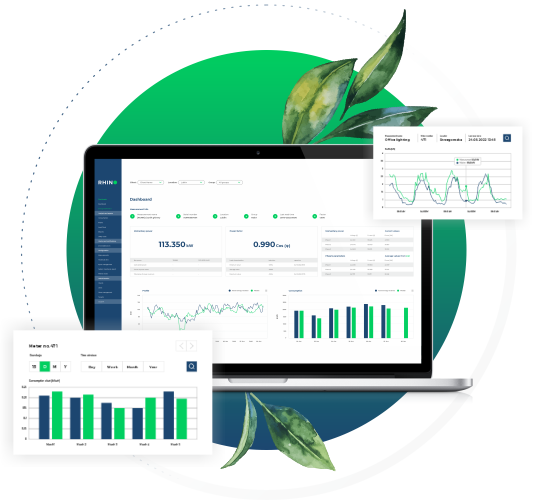
Use a set of tools that present your energy, water and gas consumption data on a variety of charts. They allow you to examine how a particular utility is consumed and compare it between buildings – not only in real time, but also against historical values. In addition, the consumption analysis allows you to check consumption trends and detect anomalies.

The aggregated data can be made available to external systems via API.

Compare and analyse utility costs

Use intelligent tools to help you determine what improvements need to be made in terms of building efficiency. Analyse and verify your savings in real time. Use valuable data for planning, thereby minimising the risk of investment failure.

Instant
malfunction notifications

Monitor the safety of your buildings 24/7 and receive real-time alerts to avoid incurring unplanned costs.

You can set up alerts for any parameters of your choice, ensuring that your maximum planned energy consumption is not exceeded, there is no water leakage, the temperature and humidity are at the right level, etc. In addition, you can rest assured that key equipment is working properly. In the event of an anomaly, you will receive a text message and email notification within 5 minutes of its occurrence.

In addition, you can use exceedance statistics to identify the most efficient buildings as well as those that need inspecting.

Create reports and share data

Receive daily or weekly reports on detected anomalies so you can use your resources to resolve them. Additionally, you can create reports according to your own criteria, or you can use templates to work even faster and take care of the environment.

One-click reporting is a universal solution that allows readings data to be exported to any billing programme, making it ideal for professionals who want to speed up their work.

Check the performance of your facilities

An intuitive presentation of instantaneous and historical consumption data in the form of a heat map shows you the consumption read at 15-minute intervals over a 30-day period. Use this functionality to determine whether the air conditioning, heating and lighting are properly adjusted at each location.

The consumption map will also clearly show the intensity with which the solar panels on your building are working.

Tailor consumption to your needs

Profiles are sets of charts presenting instantaneously read values. They can be compared against each other and against any period of your choice. This functionality will certainly help you determine the amount of power to be contracted, analyse the active/reactive energy ratio and check the temperature in your building.

Frequently asked questions


Will I receive a notification in the event of a malfunction or overrun?

In the event of failures or overruns of various types, you will immediately receive a text message and an email with the notification, any time of day or night. By responding quickly, you will minimise the losses caused by the malfunction.

The only thing you need to do is set alerts for any meter or group of meters beforehand. You can choose the alert threshold and the time of day when you wish to receive the alerts. Remember that a single meter or group of meters can be assigned more than one threshold that will trigger a notification to be sent to you when the threshold is reached.

In the notification, you will receive information about which meter the failure was detected on, at what time, what the critical threshold was set to and what value was read. In addition, once the exceedance stops, you will receive a notification that the value has returned to a safe level.


Can I automatically receive the utility consumption report on the first day of each month?

Yes, the configured utility consumption report is ready to be downloaded and/or sent automatically, once or periodically, from your locations on the first day of each month to the email addresses specified in the app. If you wish, reports can be sent weekly or even daily – you configure the report yourself.

You can also use our help to prepare the report.


Can I share selected data from the app with my tenants or customers?

Yes, the Rhino Platform allows you to share selected data. In your admin panel, assign a rank to the person you want to share the data with and indicate which meters and/or modules you want the tenant (customer) to track in order to monitor their consumption in real time.

The authorisation to assign a rank, i.e. to pass on access to the data, is given to the customer’s administrator or, at your request, to a Rhino specialist. This helps to protect your consumption data.


Can I see data from all my meters in the Rhino Platform app?

Yes, the Rhino Platform gives you 24/7 access to the consumption data from any meter in any location. The main dashboard provides quick access to the latest values read off your meters in the last 15 minutes. In addition, you can check consumption for the current month and compare it with the previous one. This shows you instantly whether you are consuming more or less utilities.

There is also an energy dashboard at your disposal, which will help you prepare the ‘E’ part of your ESG report. This dashboard allows you to keep track of the most important current parameters, e.g. those from the main meter or analyser, and compare median profile and consumption values with historical data.


Can I check the total consumption for different parts of the building or for a single tenant?

Yes. If you do not have a single master meter that measures the total consumption of circuits within, for example, a single room or area leased by one tenant, or a selected segment of the building, you can create a virtual meter, which will show the sum of selected sub-meters. This way you will obtain a single value for a room or tenant without having to manually add up individual values from separate sub-meter.


Ready for savings?